Height Measuring Station for Concrete Bricks
Timeline
March 2018 - March 2023
Active Development: ~4 years
Team
Size: 4 people
Role: Lead Developer & Product Designer
An industrial-grade laser distance sensor-based height measurement system for concrete brick production, developed from concept to deployment. The system provides real-time height monitoring of every brick on the production line with remote diagnostics capabilities. Starting with the initial idea, we designed and engineered every component: custom 3D-printed housing and mounting structures, custom PCBs and electronics, and a complete software stack including sensor data processing algorithms and an operator interface. Successfully deployed across multiple production facilities, replacing manual inspection processes with automated quality control. This project marked the founding of our company NEWTEQ and taught us valuable lessons in industrial product design, embedded systems, and software development while engineering systems resilient enough to operate in harsh industrial environments with minimal human intervention.
The Backstory
Shortly after finishing our cocktail machine, a local concrete brick manufacturer approached us (Janis Ax and me) with an interesting challenge: Could we build a system capable of automatically verifying that newly produced bricks conformed to specified dimensional tolerances?
There existed commercial solutions already, but those were too expensive. This pushed the client to search for alternatives that could still meet the required performance and reliability. Until then, the existing process was fully manual: every 30 minutes, an operator would measure a few bricks with a depth gauge — meaning that hundreds of bricks could be produced between checks. Not ideal if you're trying to catch defective batches early.
We had never worked on industrial systems before, but honestly, that just made it more exciting. We jumped in head-first — and in the process, founded our company, NEWTEQ. 🎉
Requirements and Specifications
Our first big question: How do you actually measure brick heights reliably, automatically, and in a rough factory environment?
The system needed to:
- Measure bricks up to 400 mm with ~0.5 mm precision.
- Be fully contactless (no touching the bricks while they move).
- Survive dust, vibrations, heat, and general factory abuse.
- Require minimal maintenance.
- Be simple for operators to use.
With these criteria in mind, we explored different sensor technologies. Laser distance sensors quickly emerged as the most promising solution: they could achieve the necessary precision and range, deliver enough measurement points per second to effectively "scan" the bricks, and offer contact-free measurement — eliminating any risk of interfering with the bricks themselves.
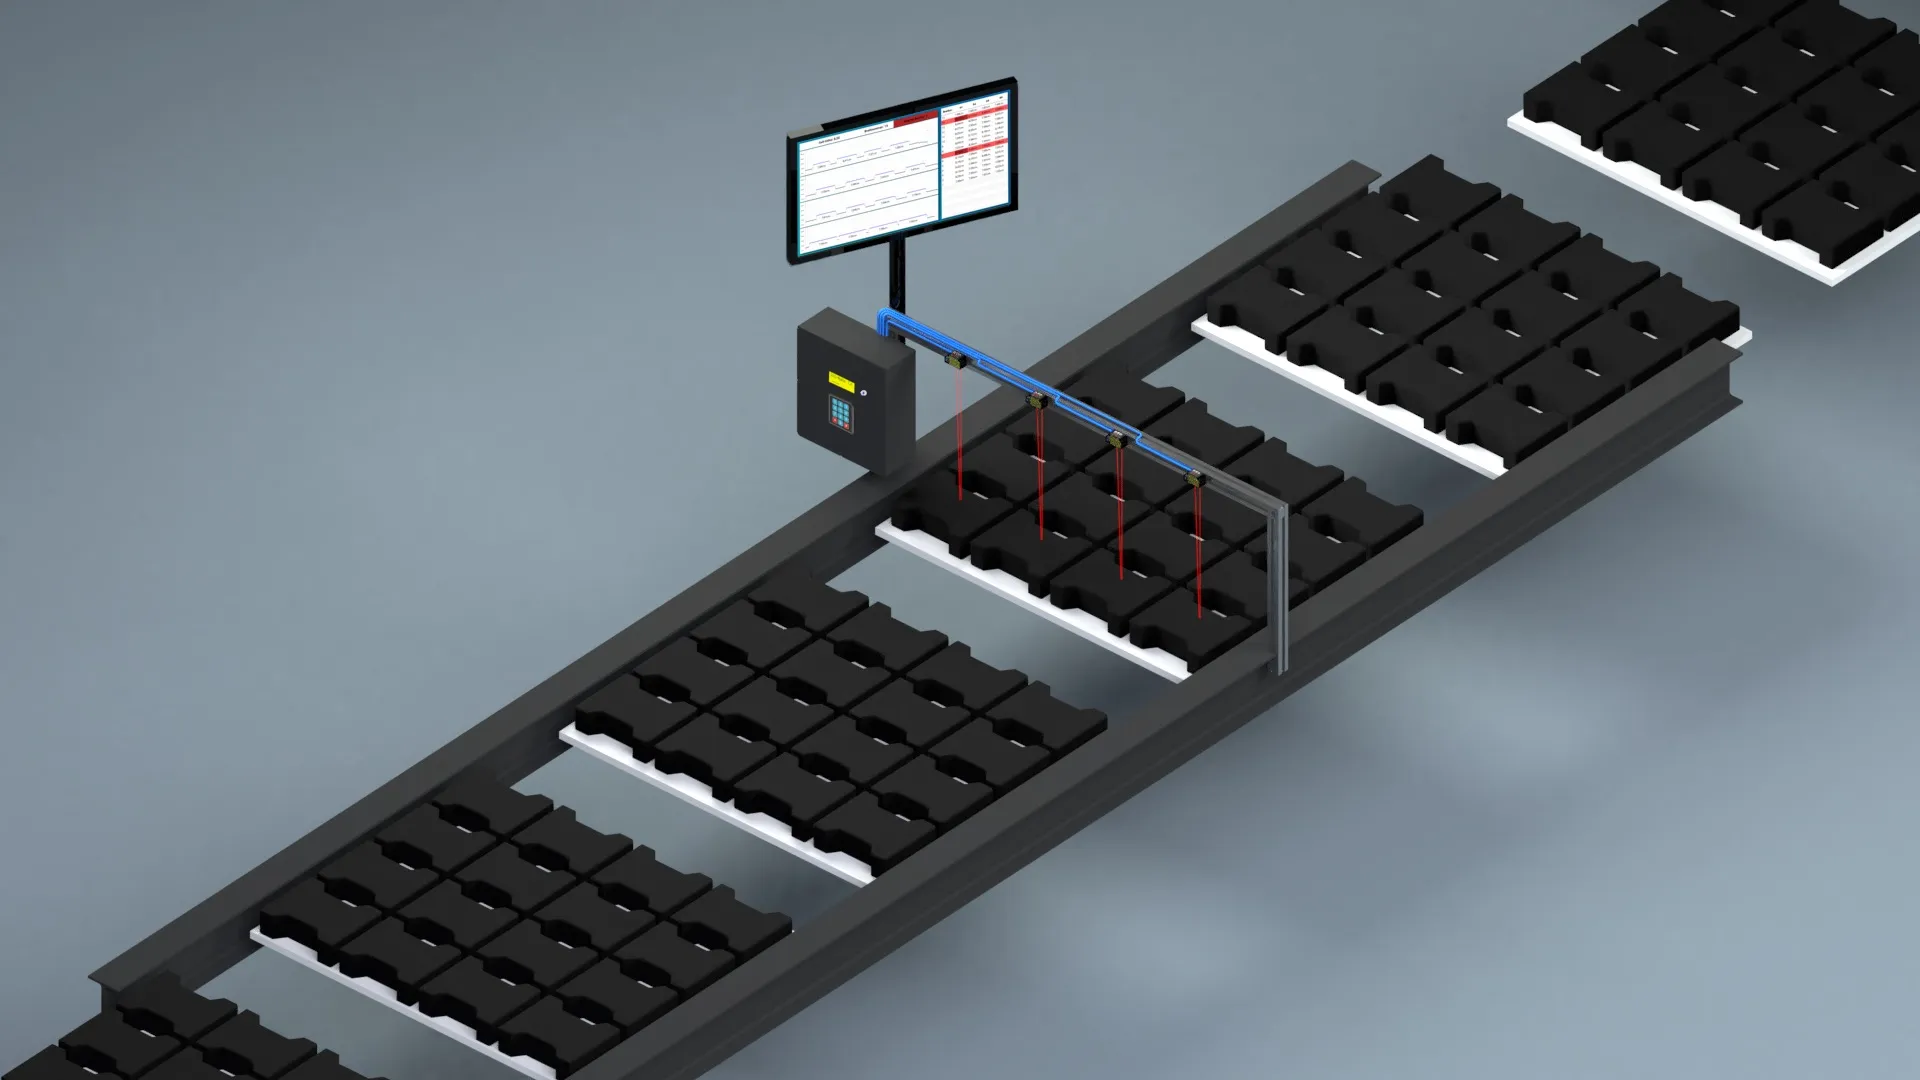
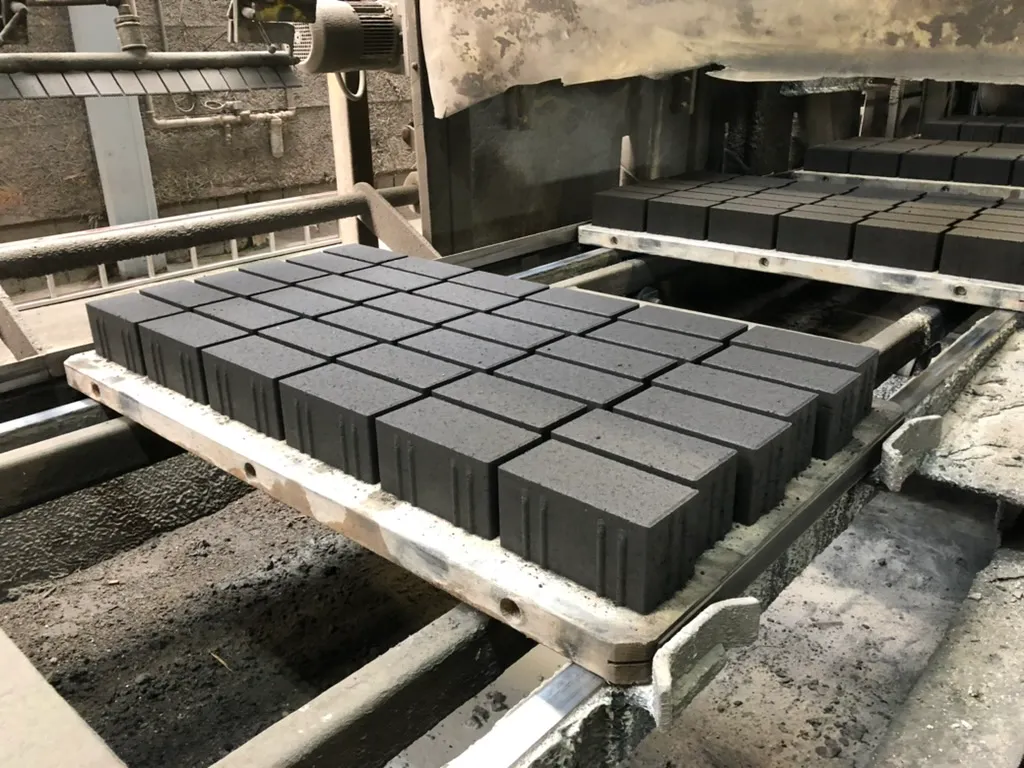
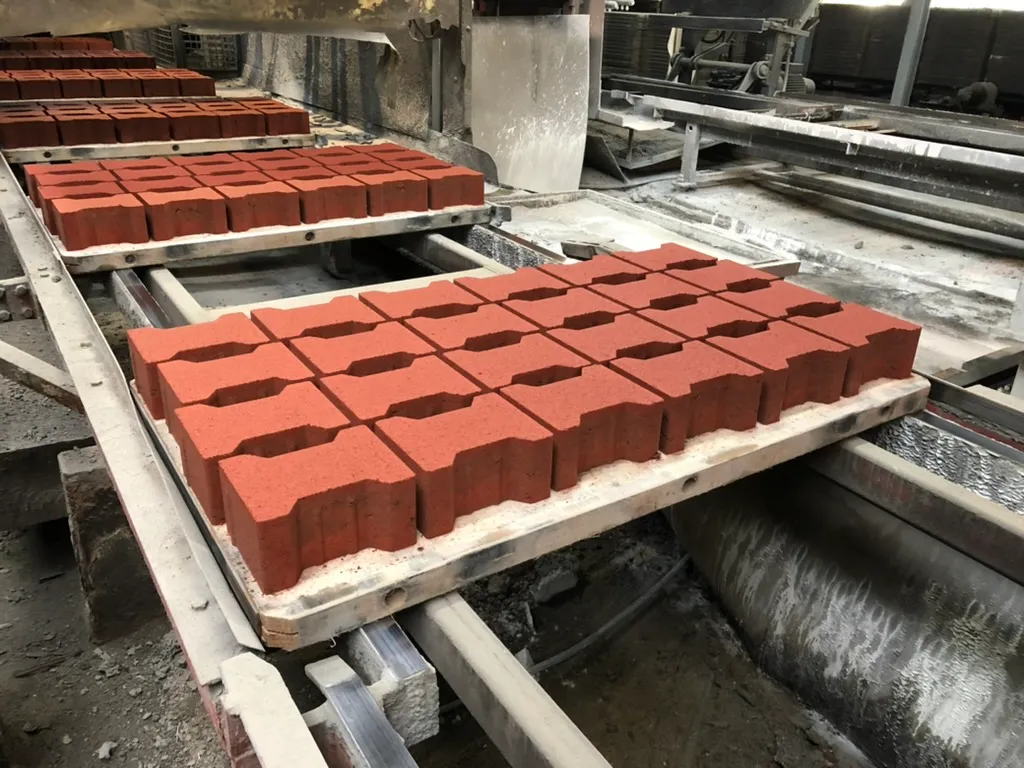
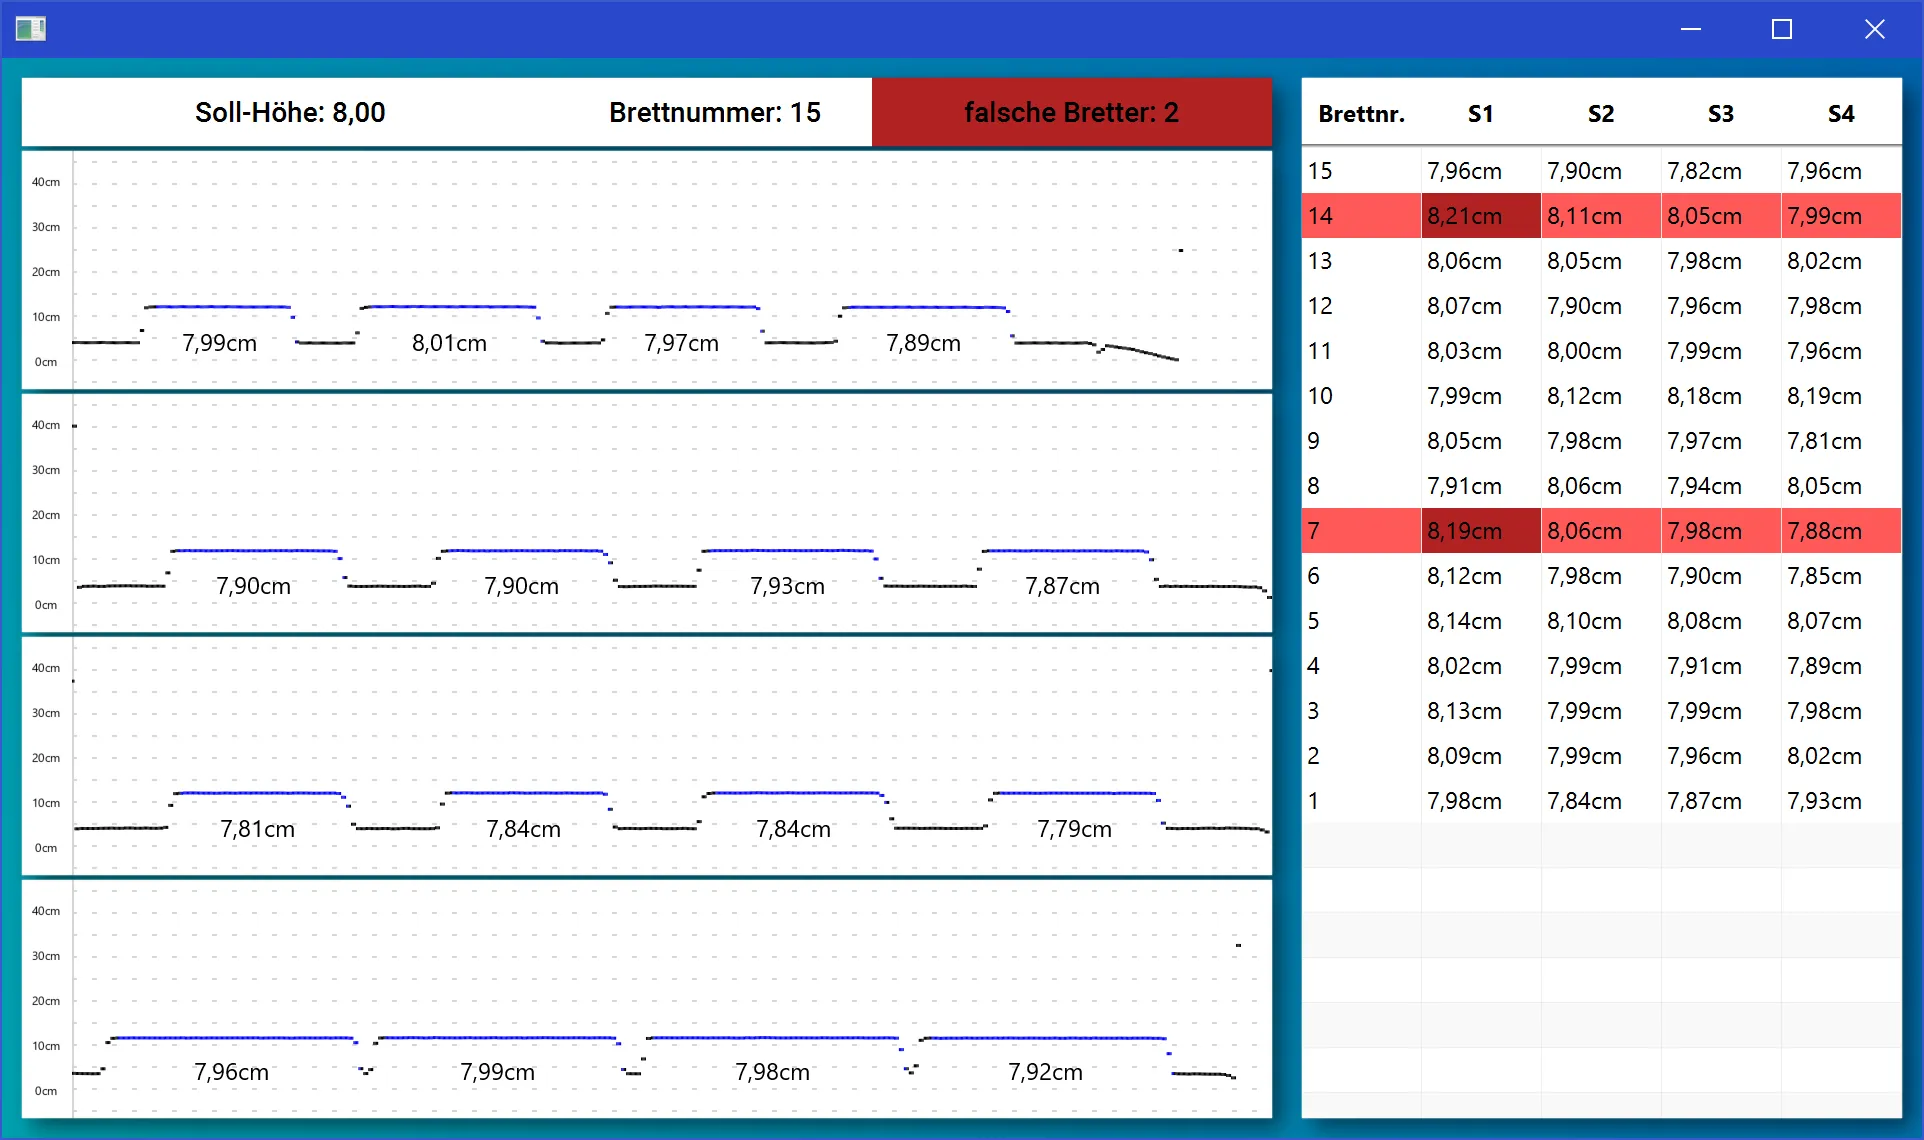
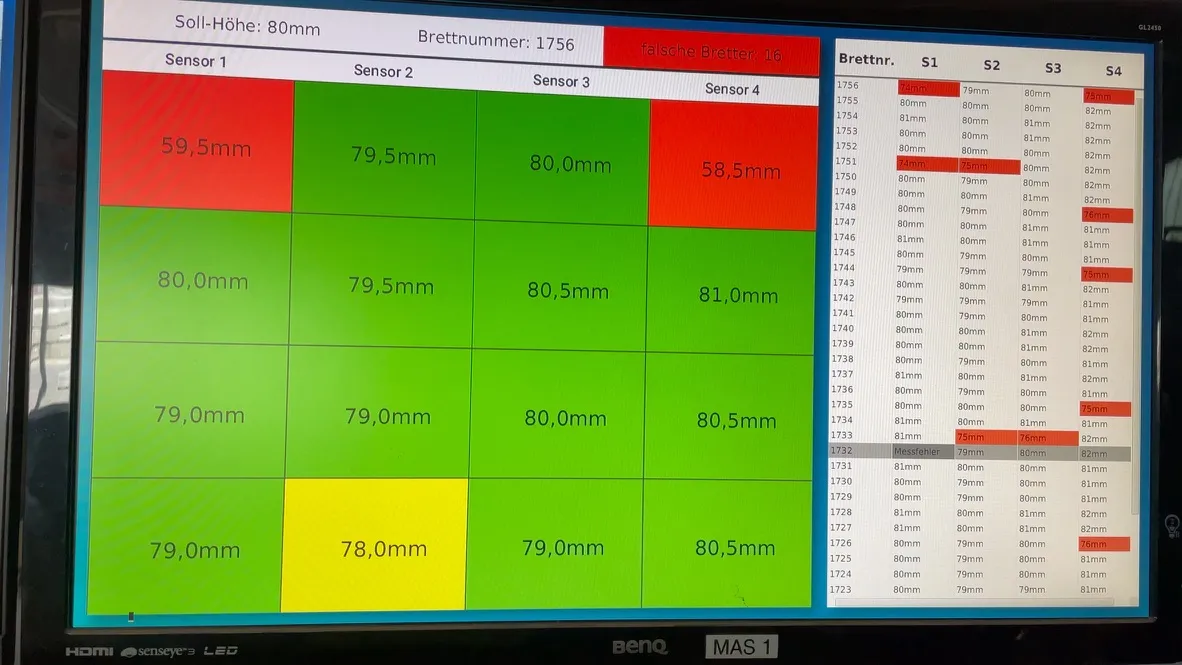
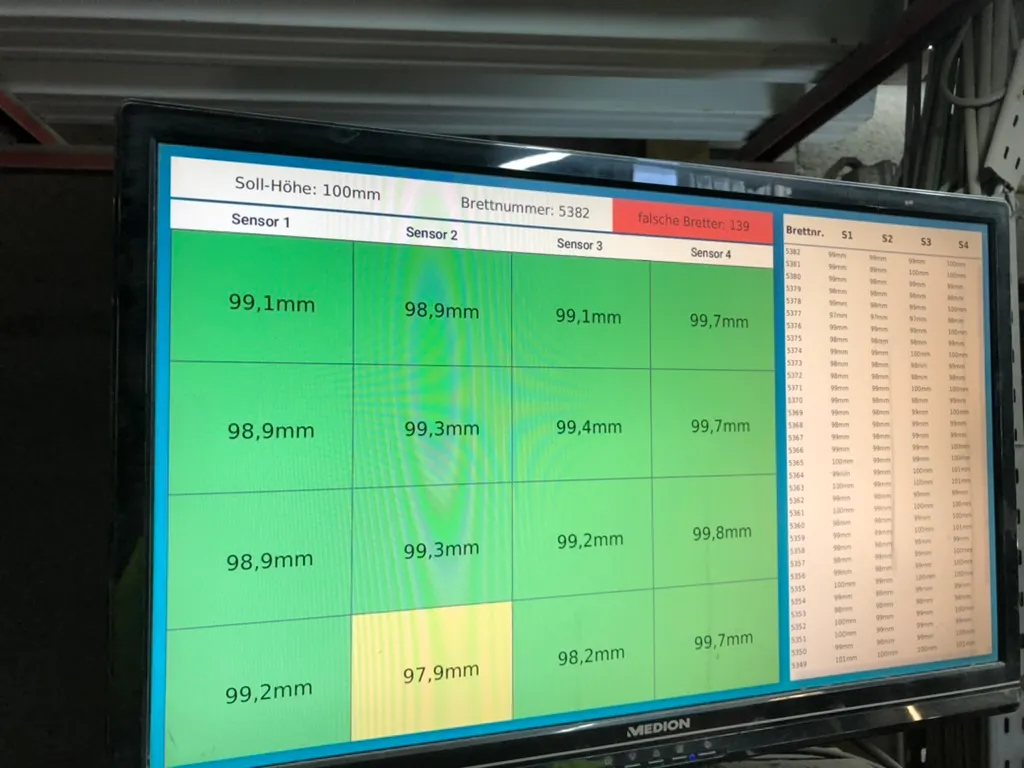
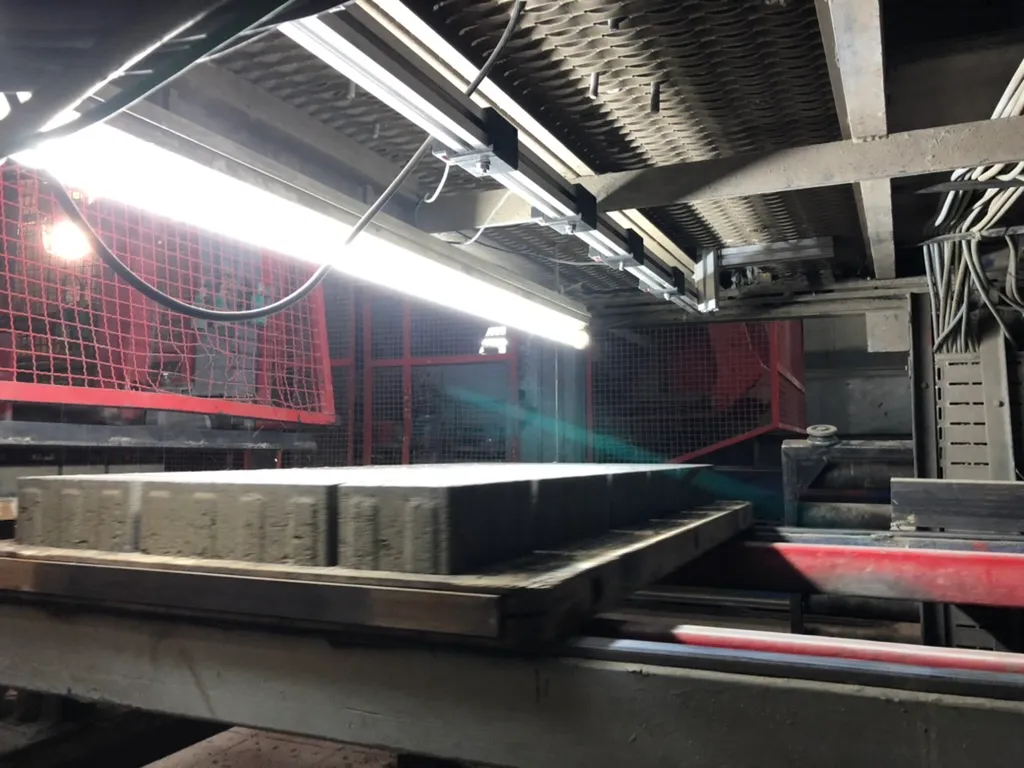
The station is therefore mounted in a fixed position above the production line, directly after the press and before curing, measuring each board as it passes. Each board carries a grid of bricks (number of bricks depends on the mold used), which is mirrored in the UI.
While the boards move beneath the stationary sensors, they effectively “scan” the surface, capturing continuous height data across the board and the bricks. From this stream of data, the system identifies two characteristic height levels: the lower level corresponds to the production board, and the higher level to the top surfaces of the bricks. By averaging the low values, the system determines the reference height of the board, while the high values yield the absolute height of the bricks. Subtracting these two values gives the relative brick height, independent of any variation in board thickness or sensor calibration.
The image above illustrates the physical setup of the sensors and measurement geometry (side view). A 120 mm preflight distance is needed by the sensors. The next 150 mm are the actual measurement range. The last 10mm are used as tolerance to account for any slight variation in the sensor's position and board height. We initially targeted ~400 mm range with ~0.5 mm precision. Field testing (more on that later) showed that a shorter-range, higher-precision sensor performed better. Since production heights are typically 60–120 mm, the final system’s ~150 mm measurement range comfortably covers all products with margin.
Early Prototyping and Building the First Version
Initially, we experimented with some cheap Arduino-compatible time-of-flight sensors (because of course we did 😄), but they weren’t accurate or robust enough for production. Eventually, after far too much spec sheet reading, we found an industrial sensor that hit all the right marks (or so we thought).
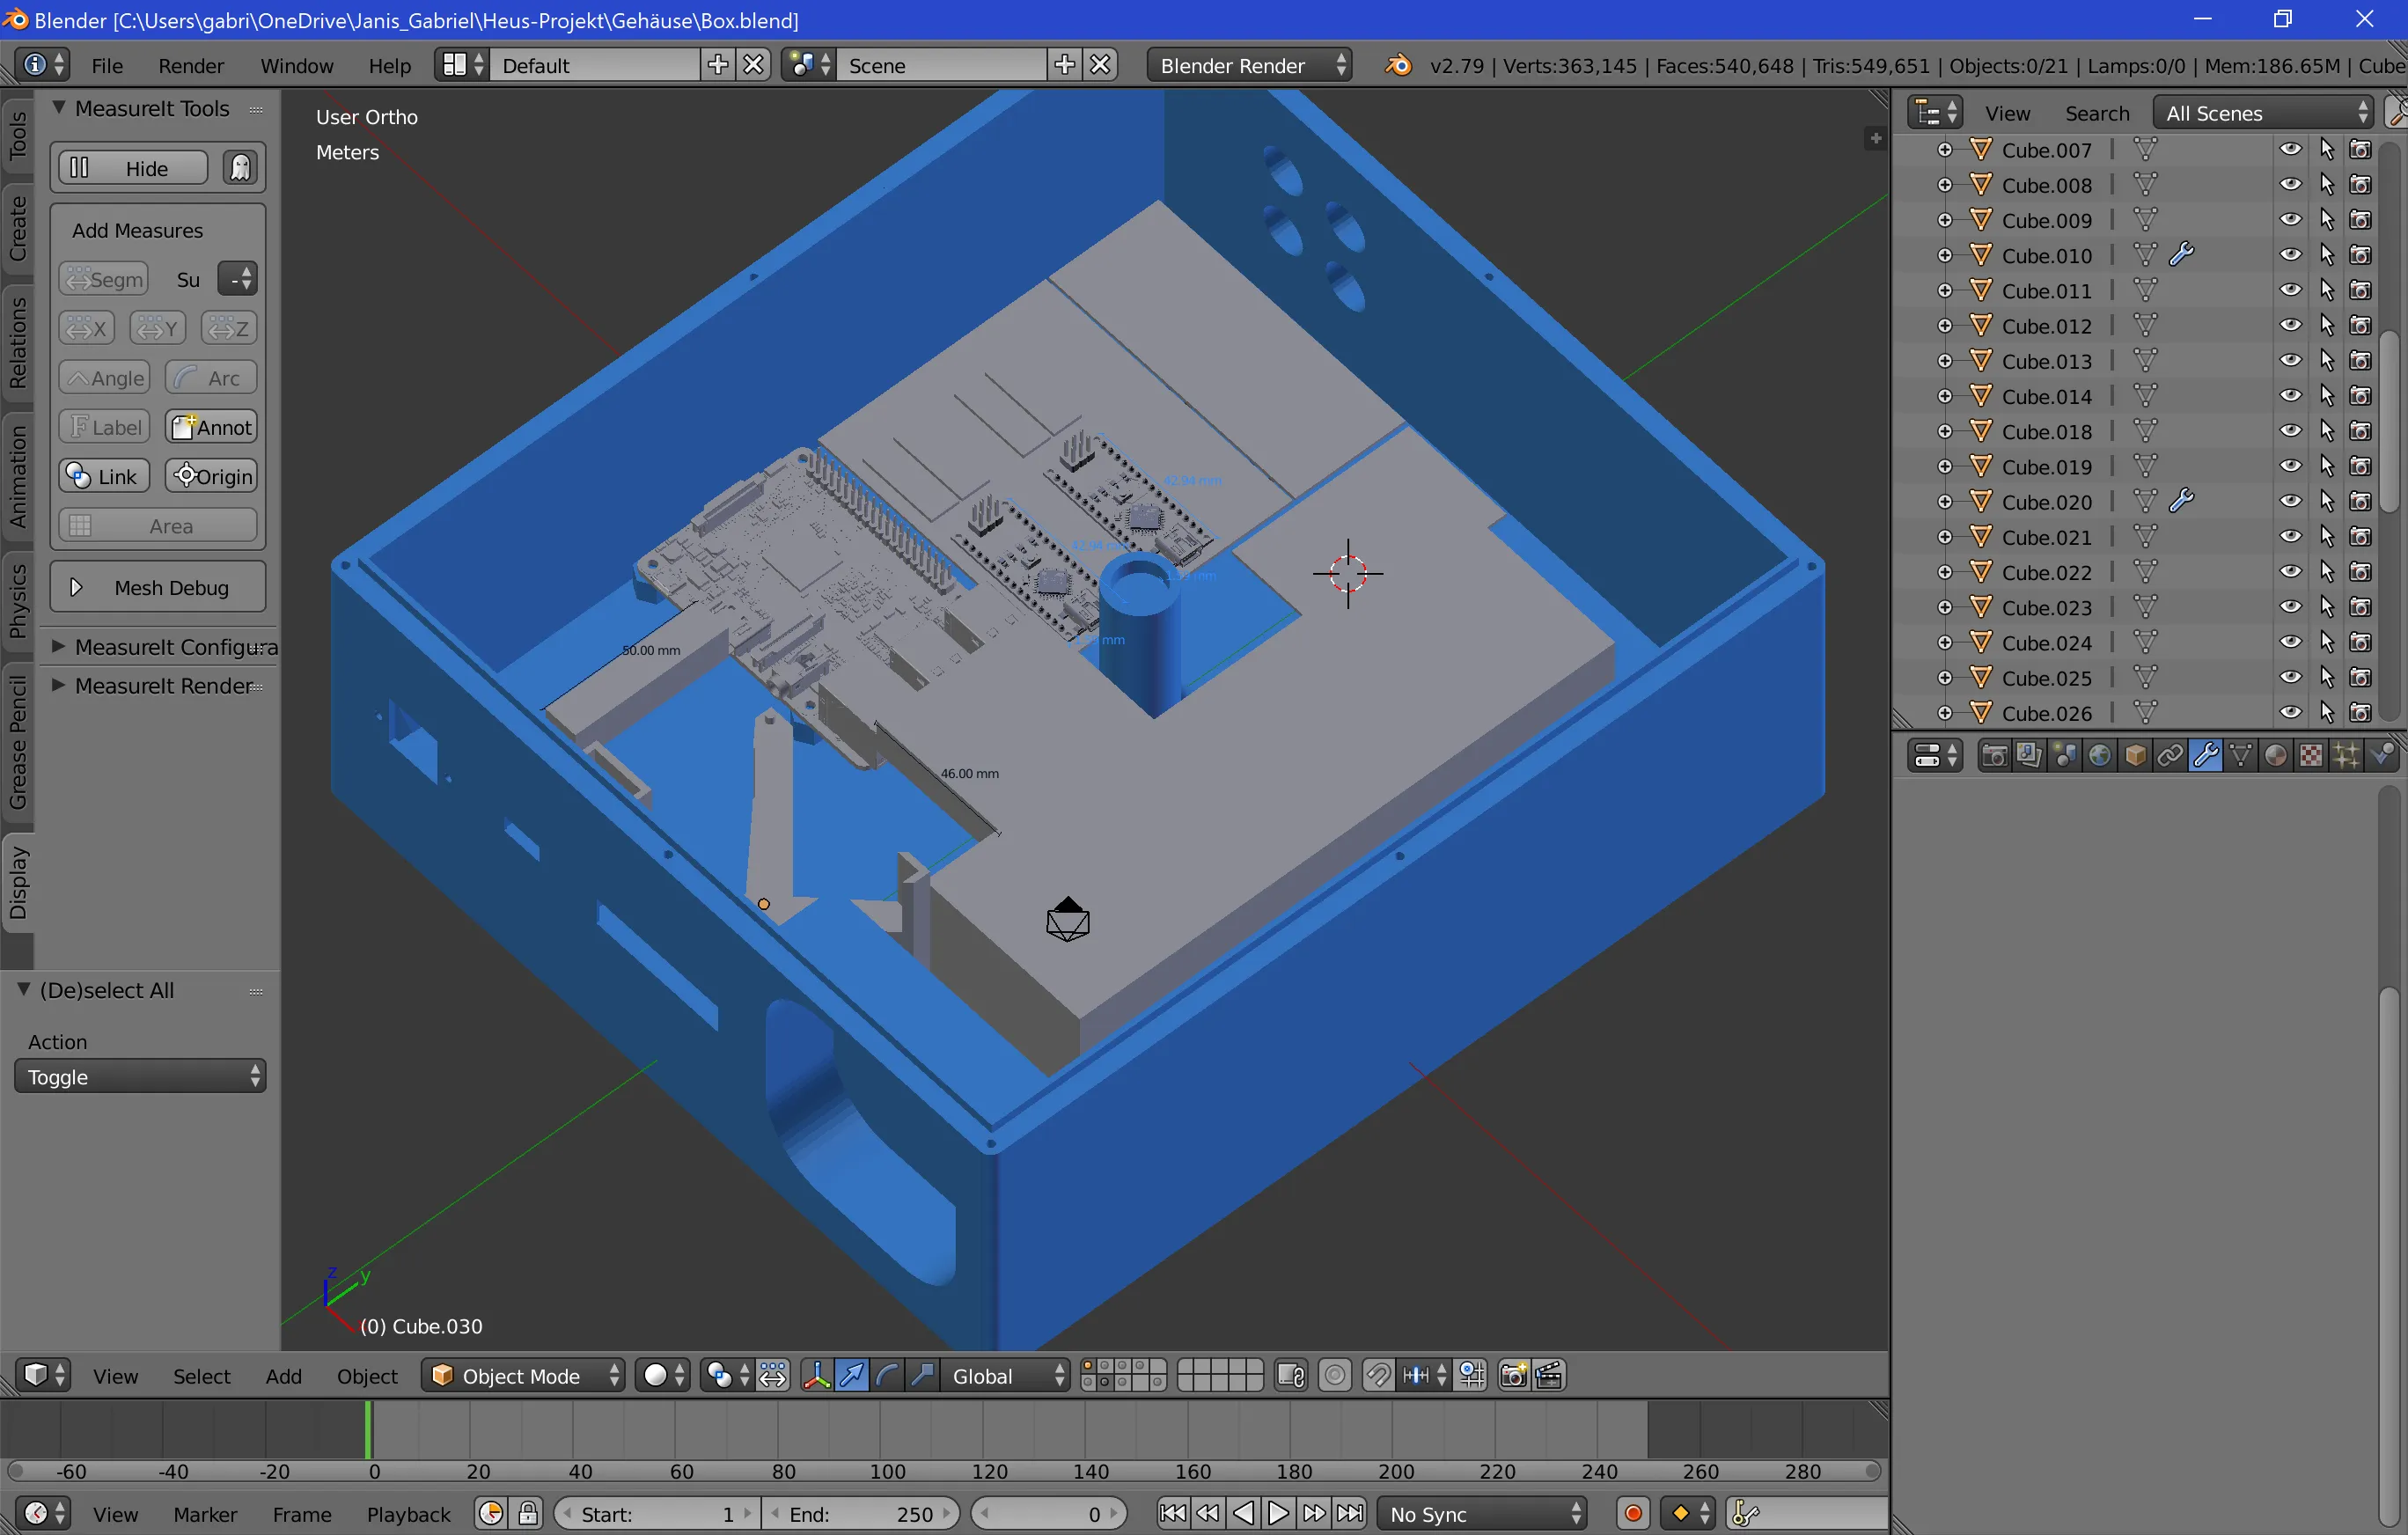
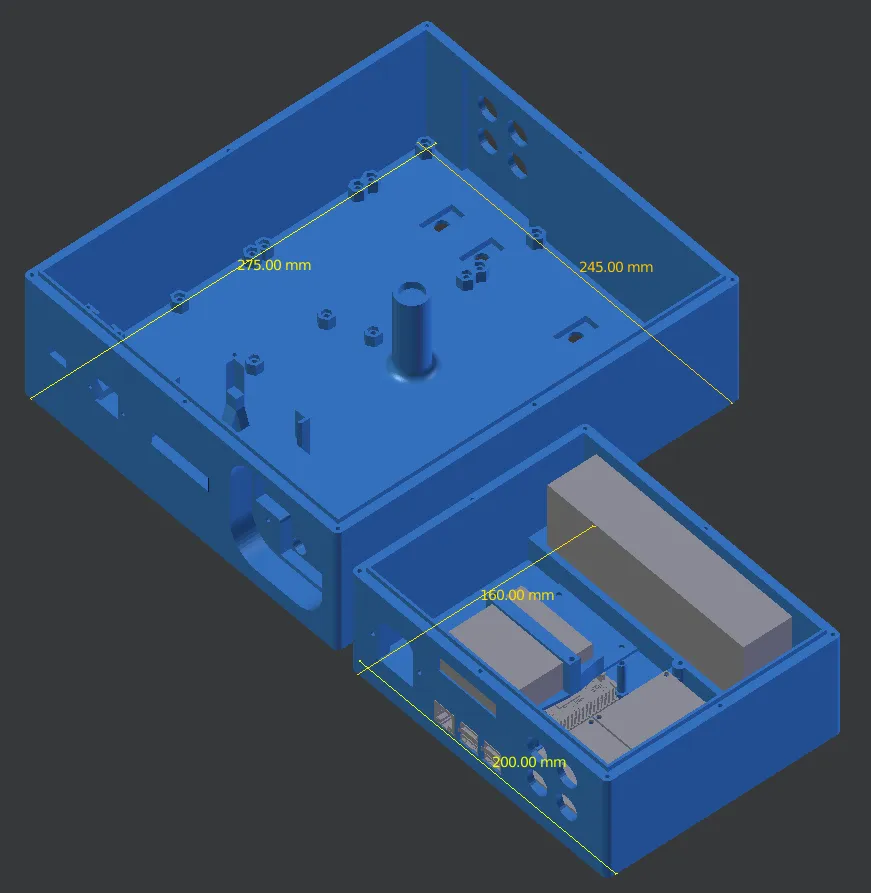
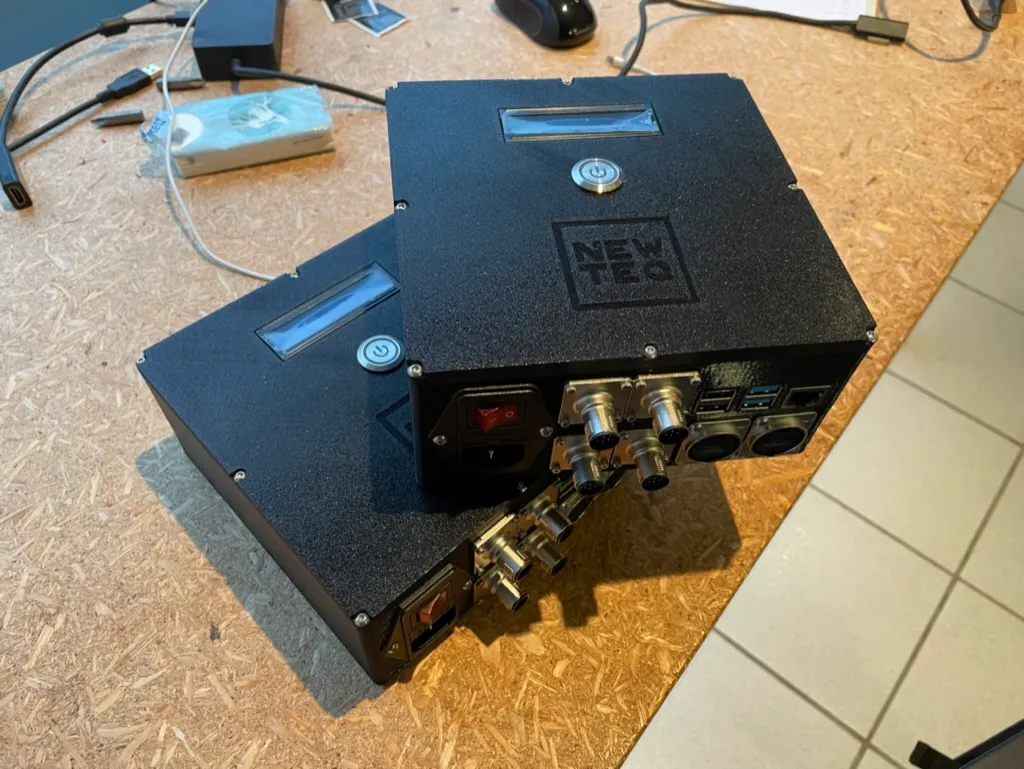
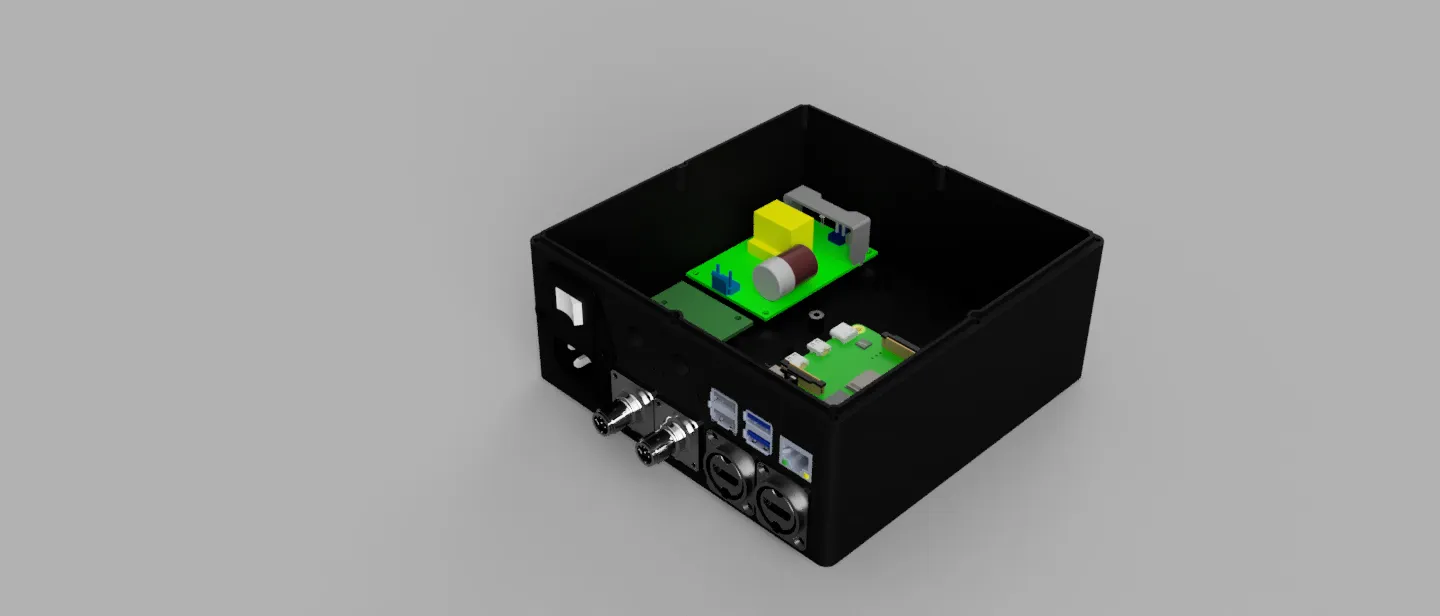
From there, we built out the rest of the system (see 3D render above):
- Custom 3D-printed mounts to hold the sensors in place.
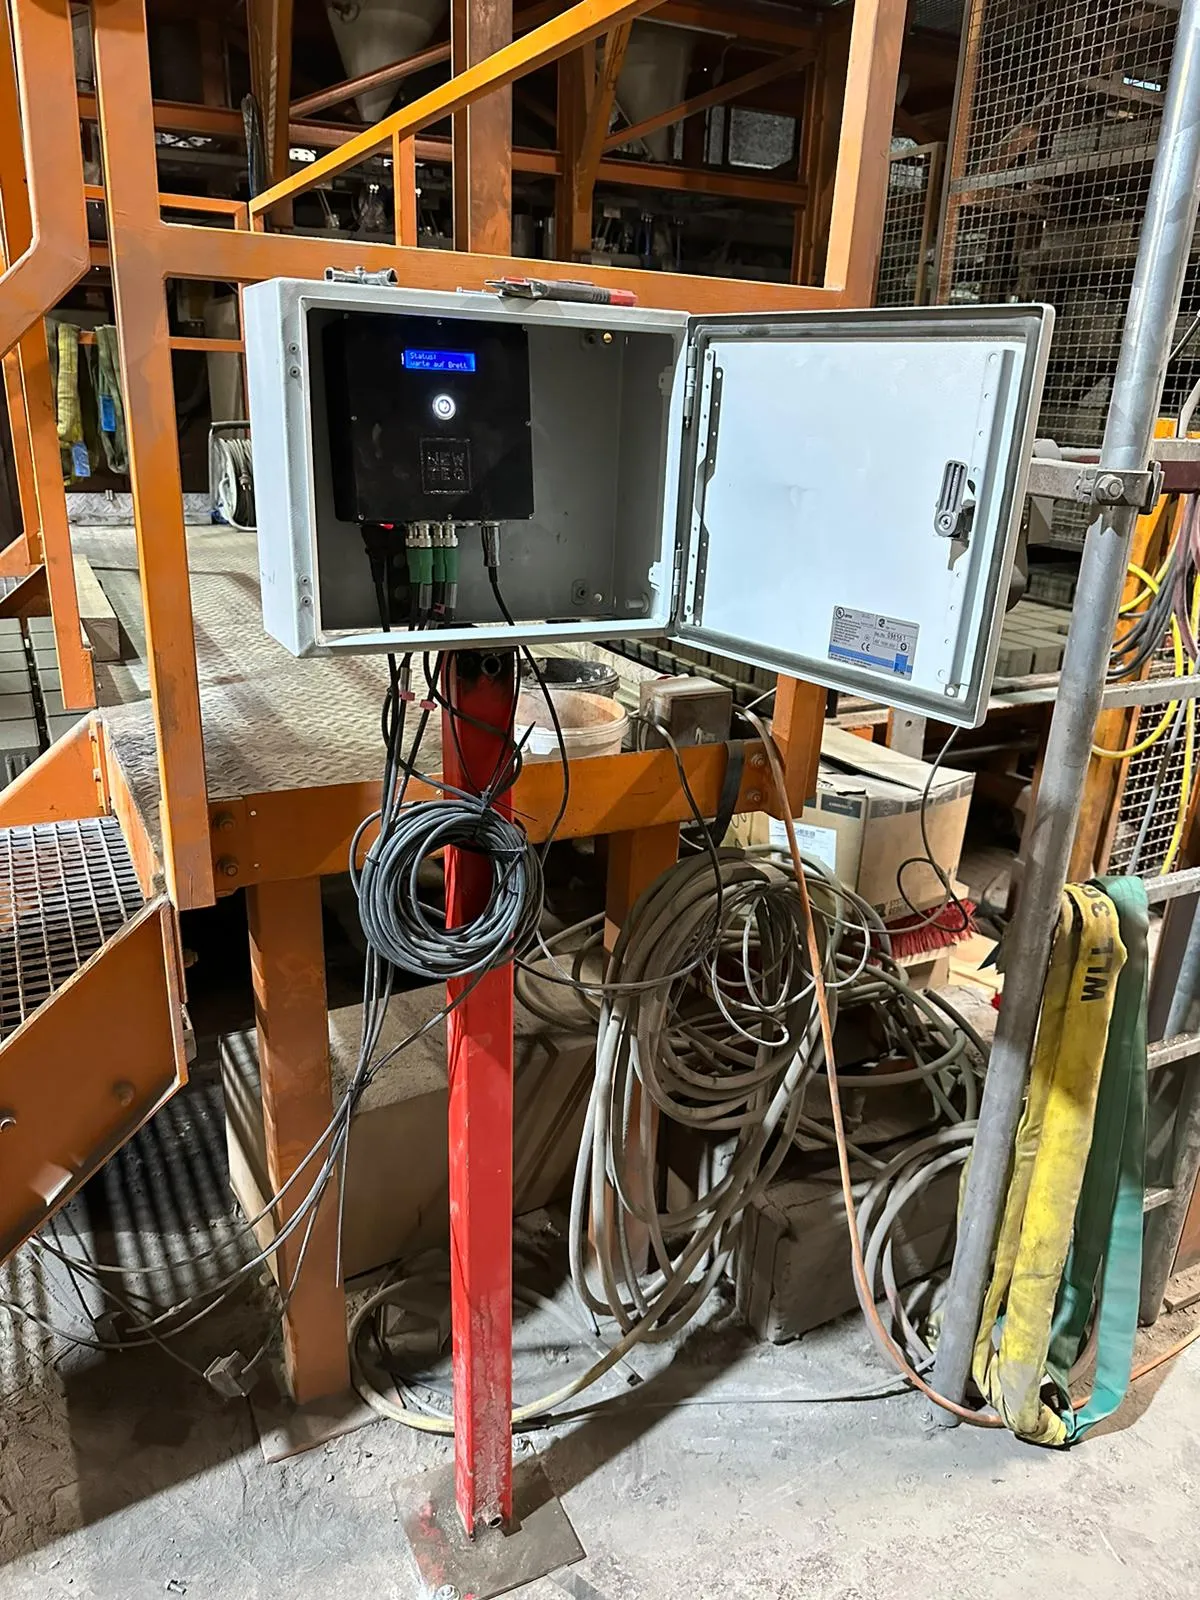
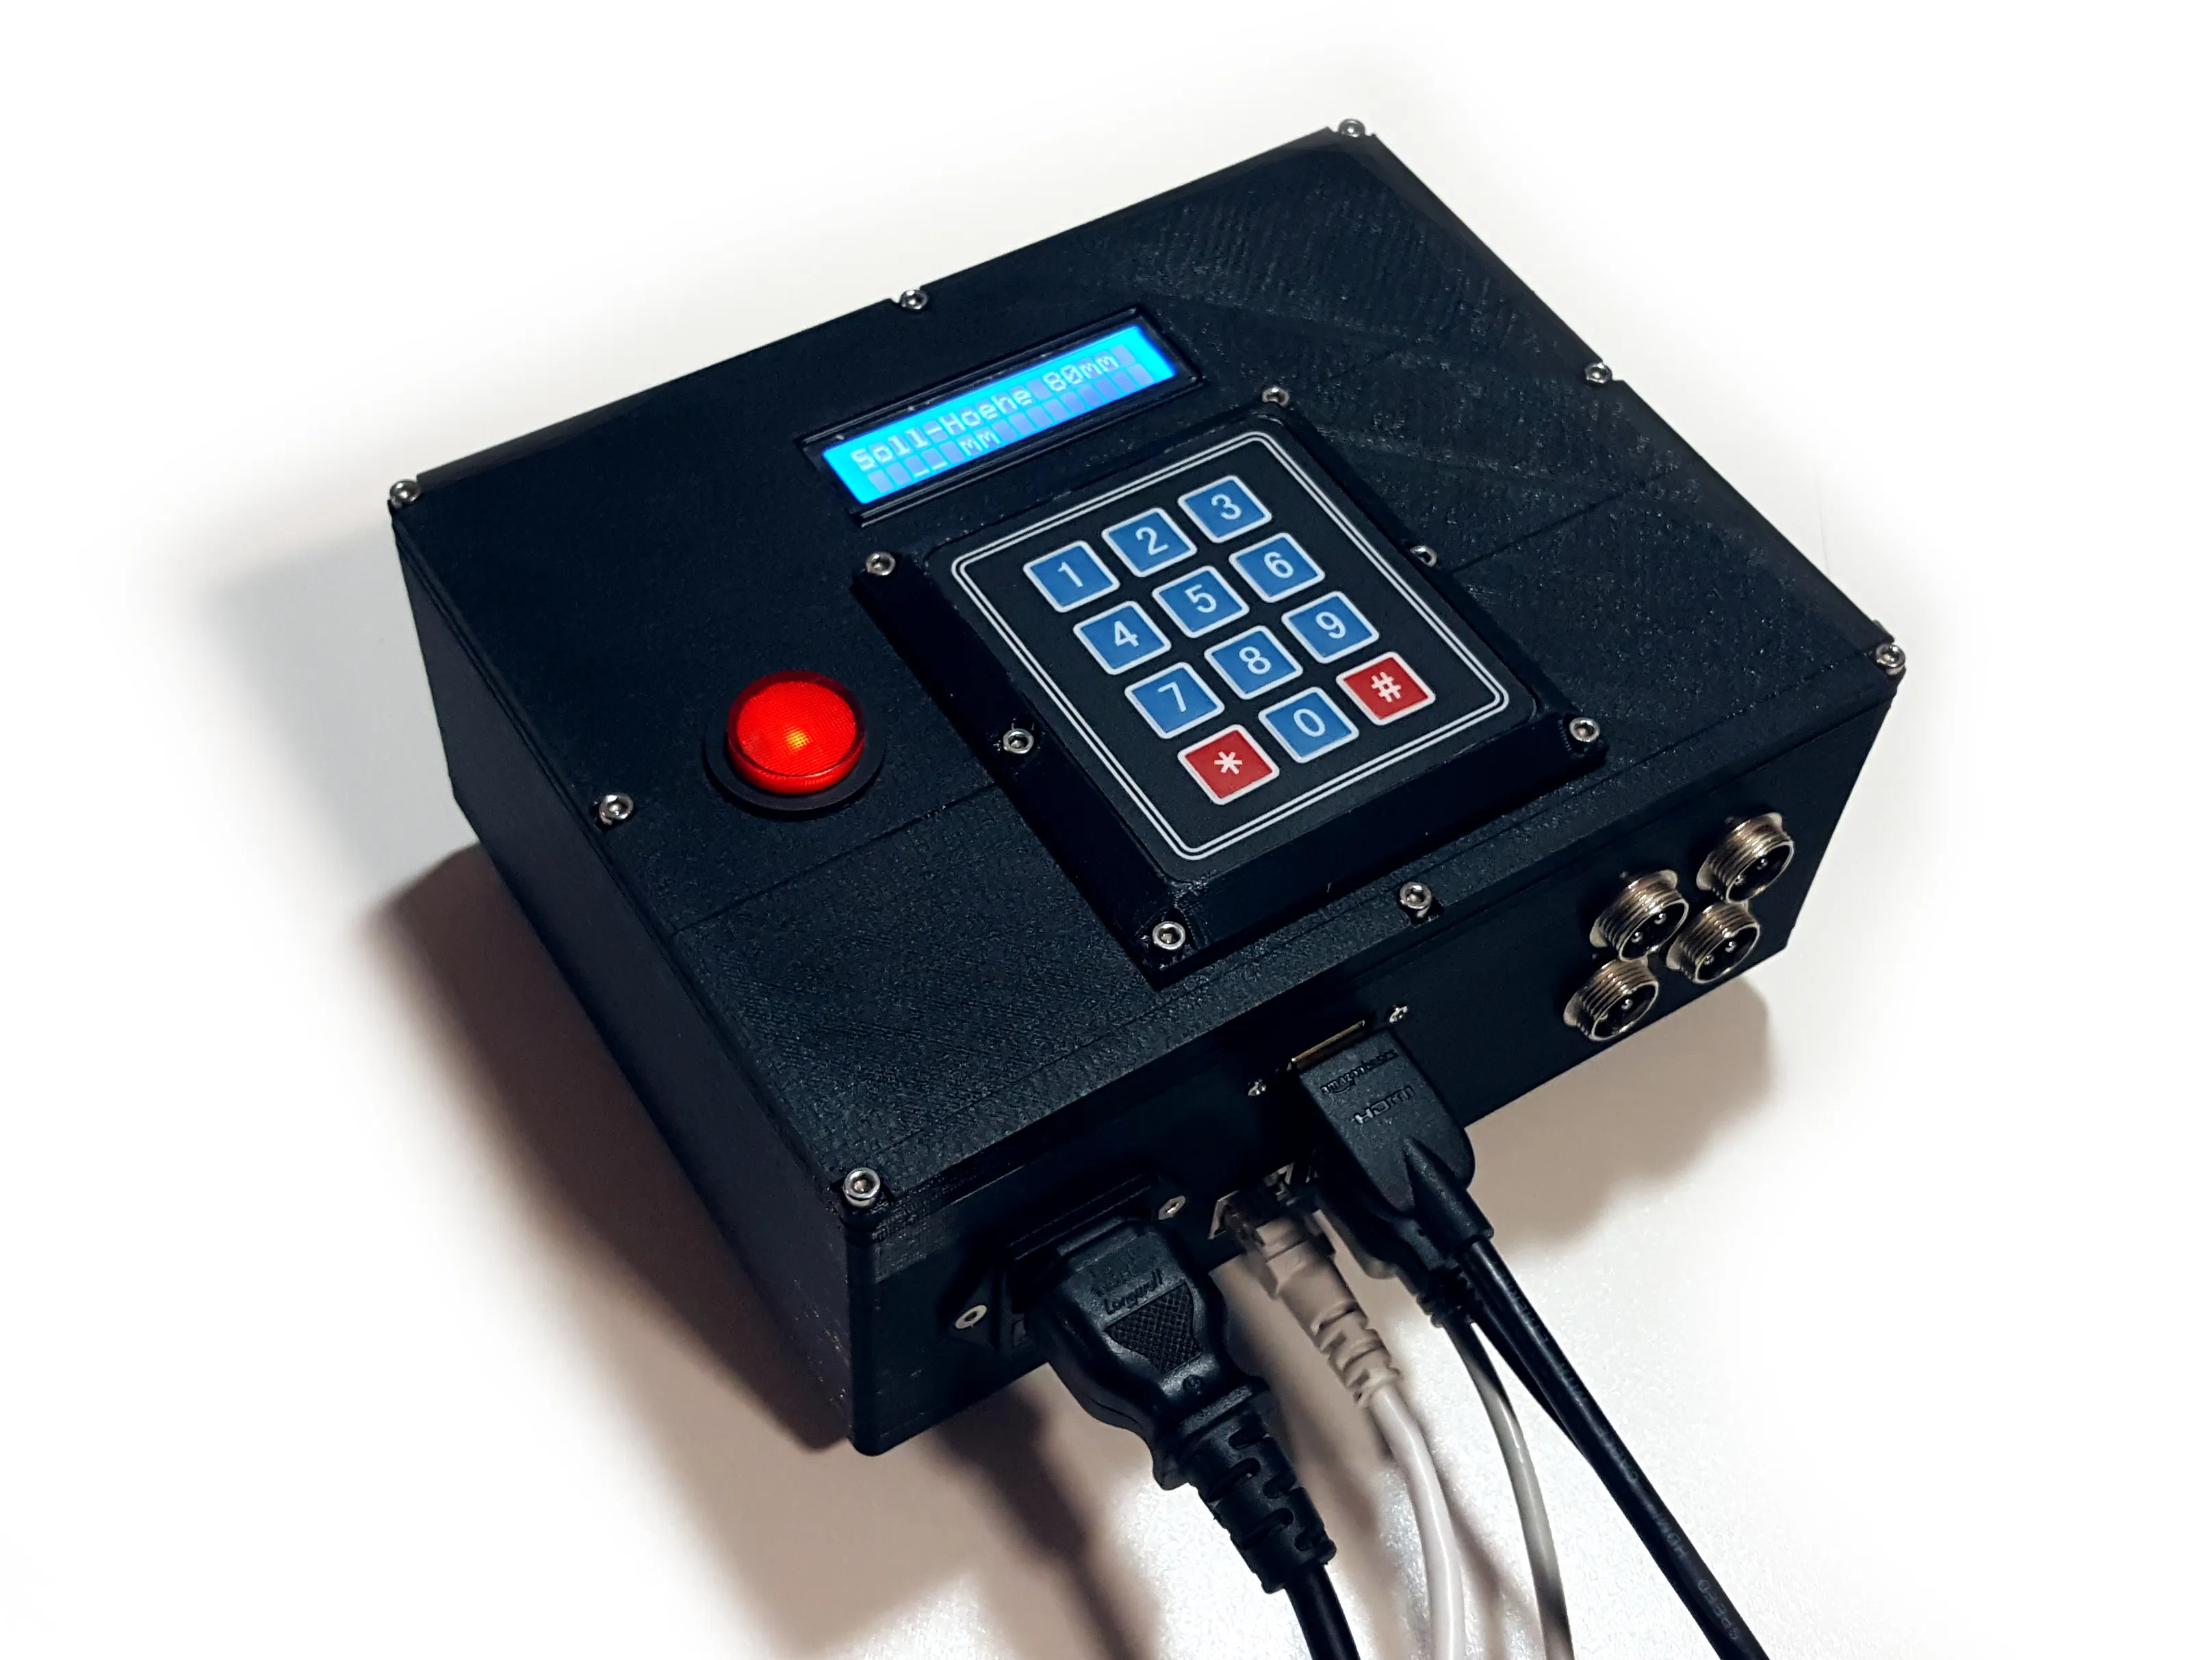
- A control unit with a Raspberry Pi, custom PCBs, power management circuits, and ADCs.
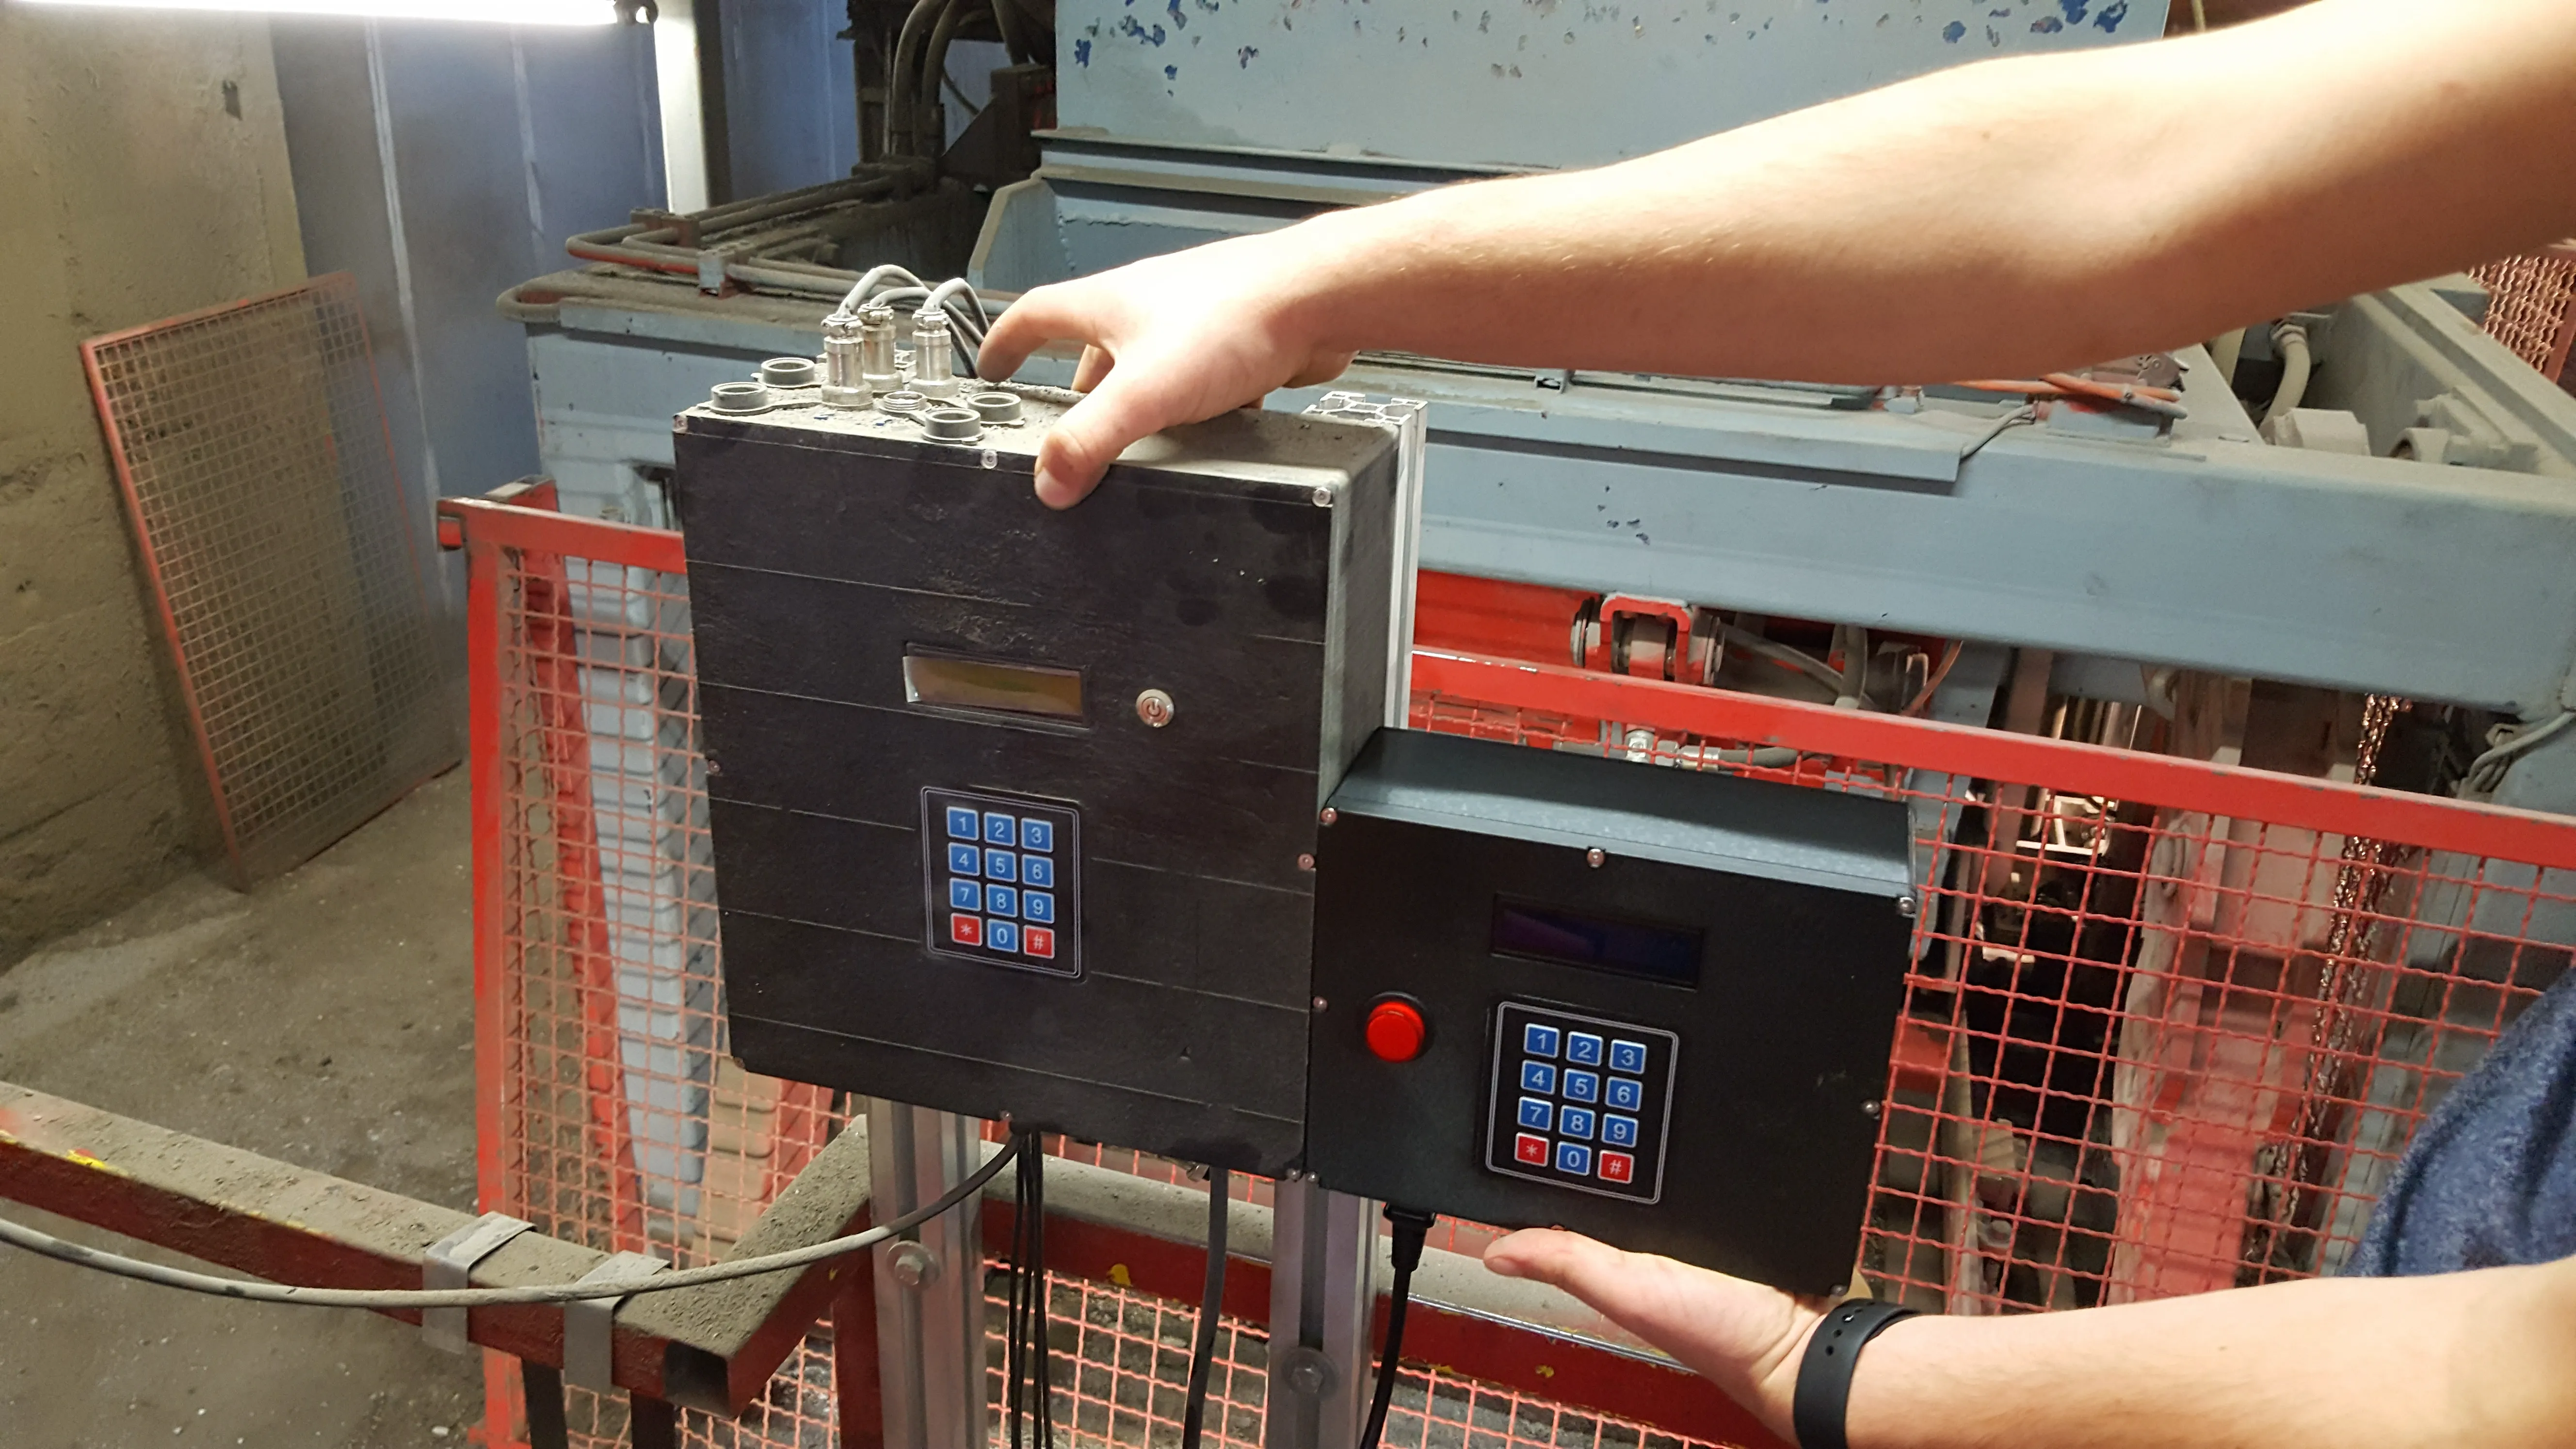
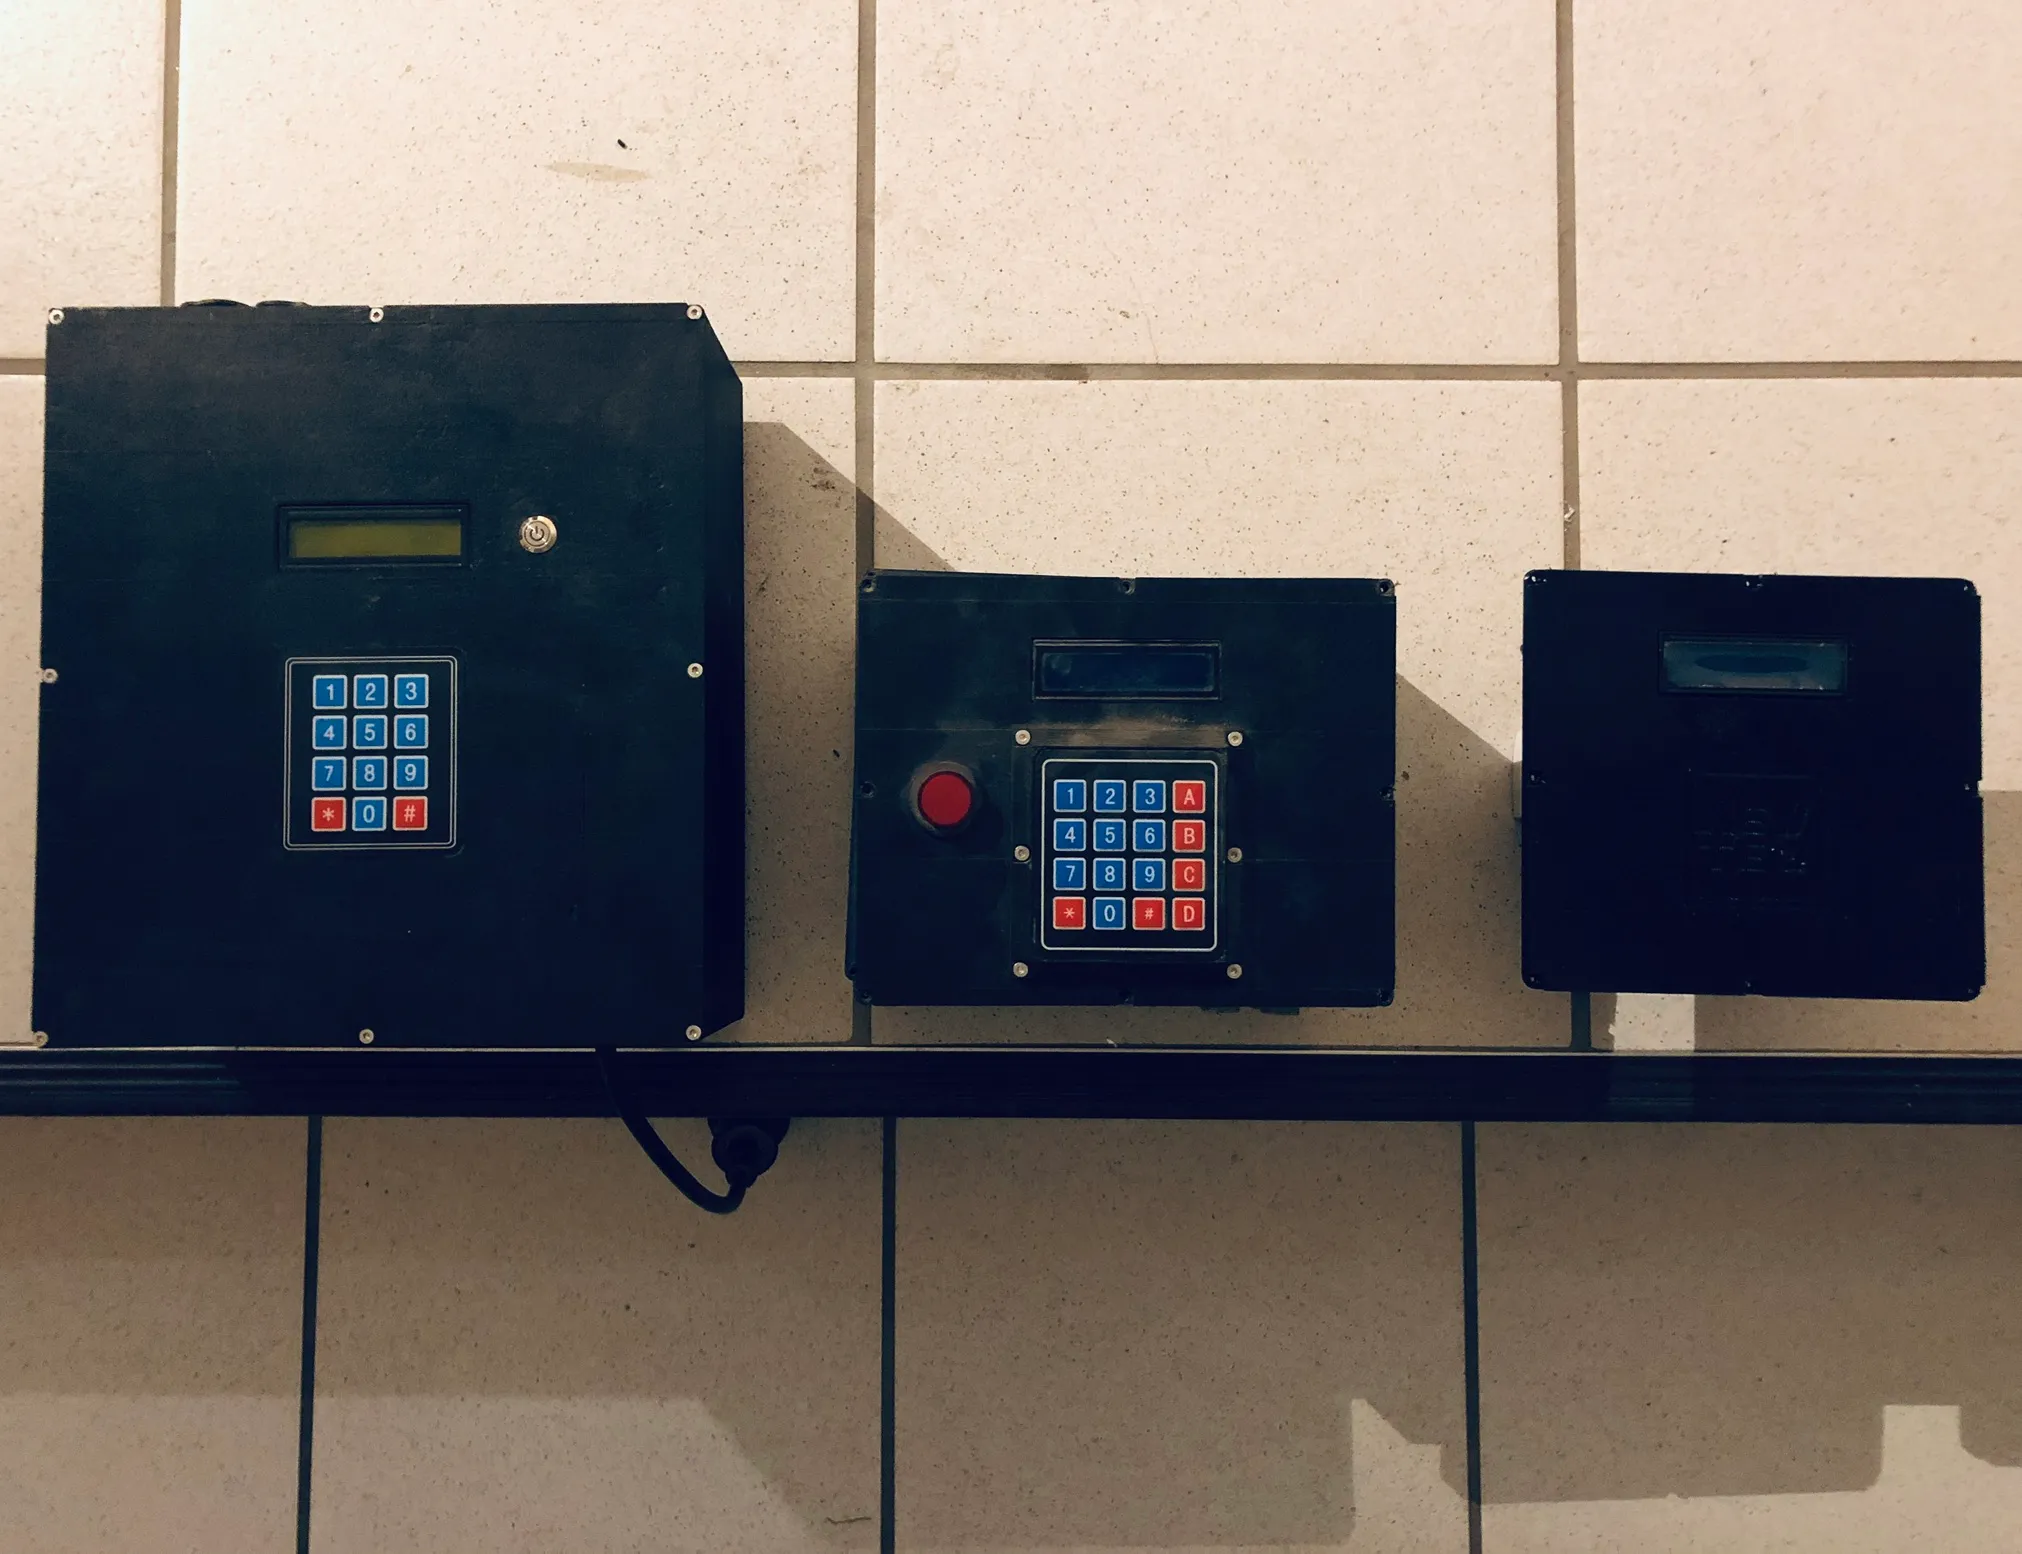
- Two displays: one on the line for operators, one in the control room for supervisors.
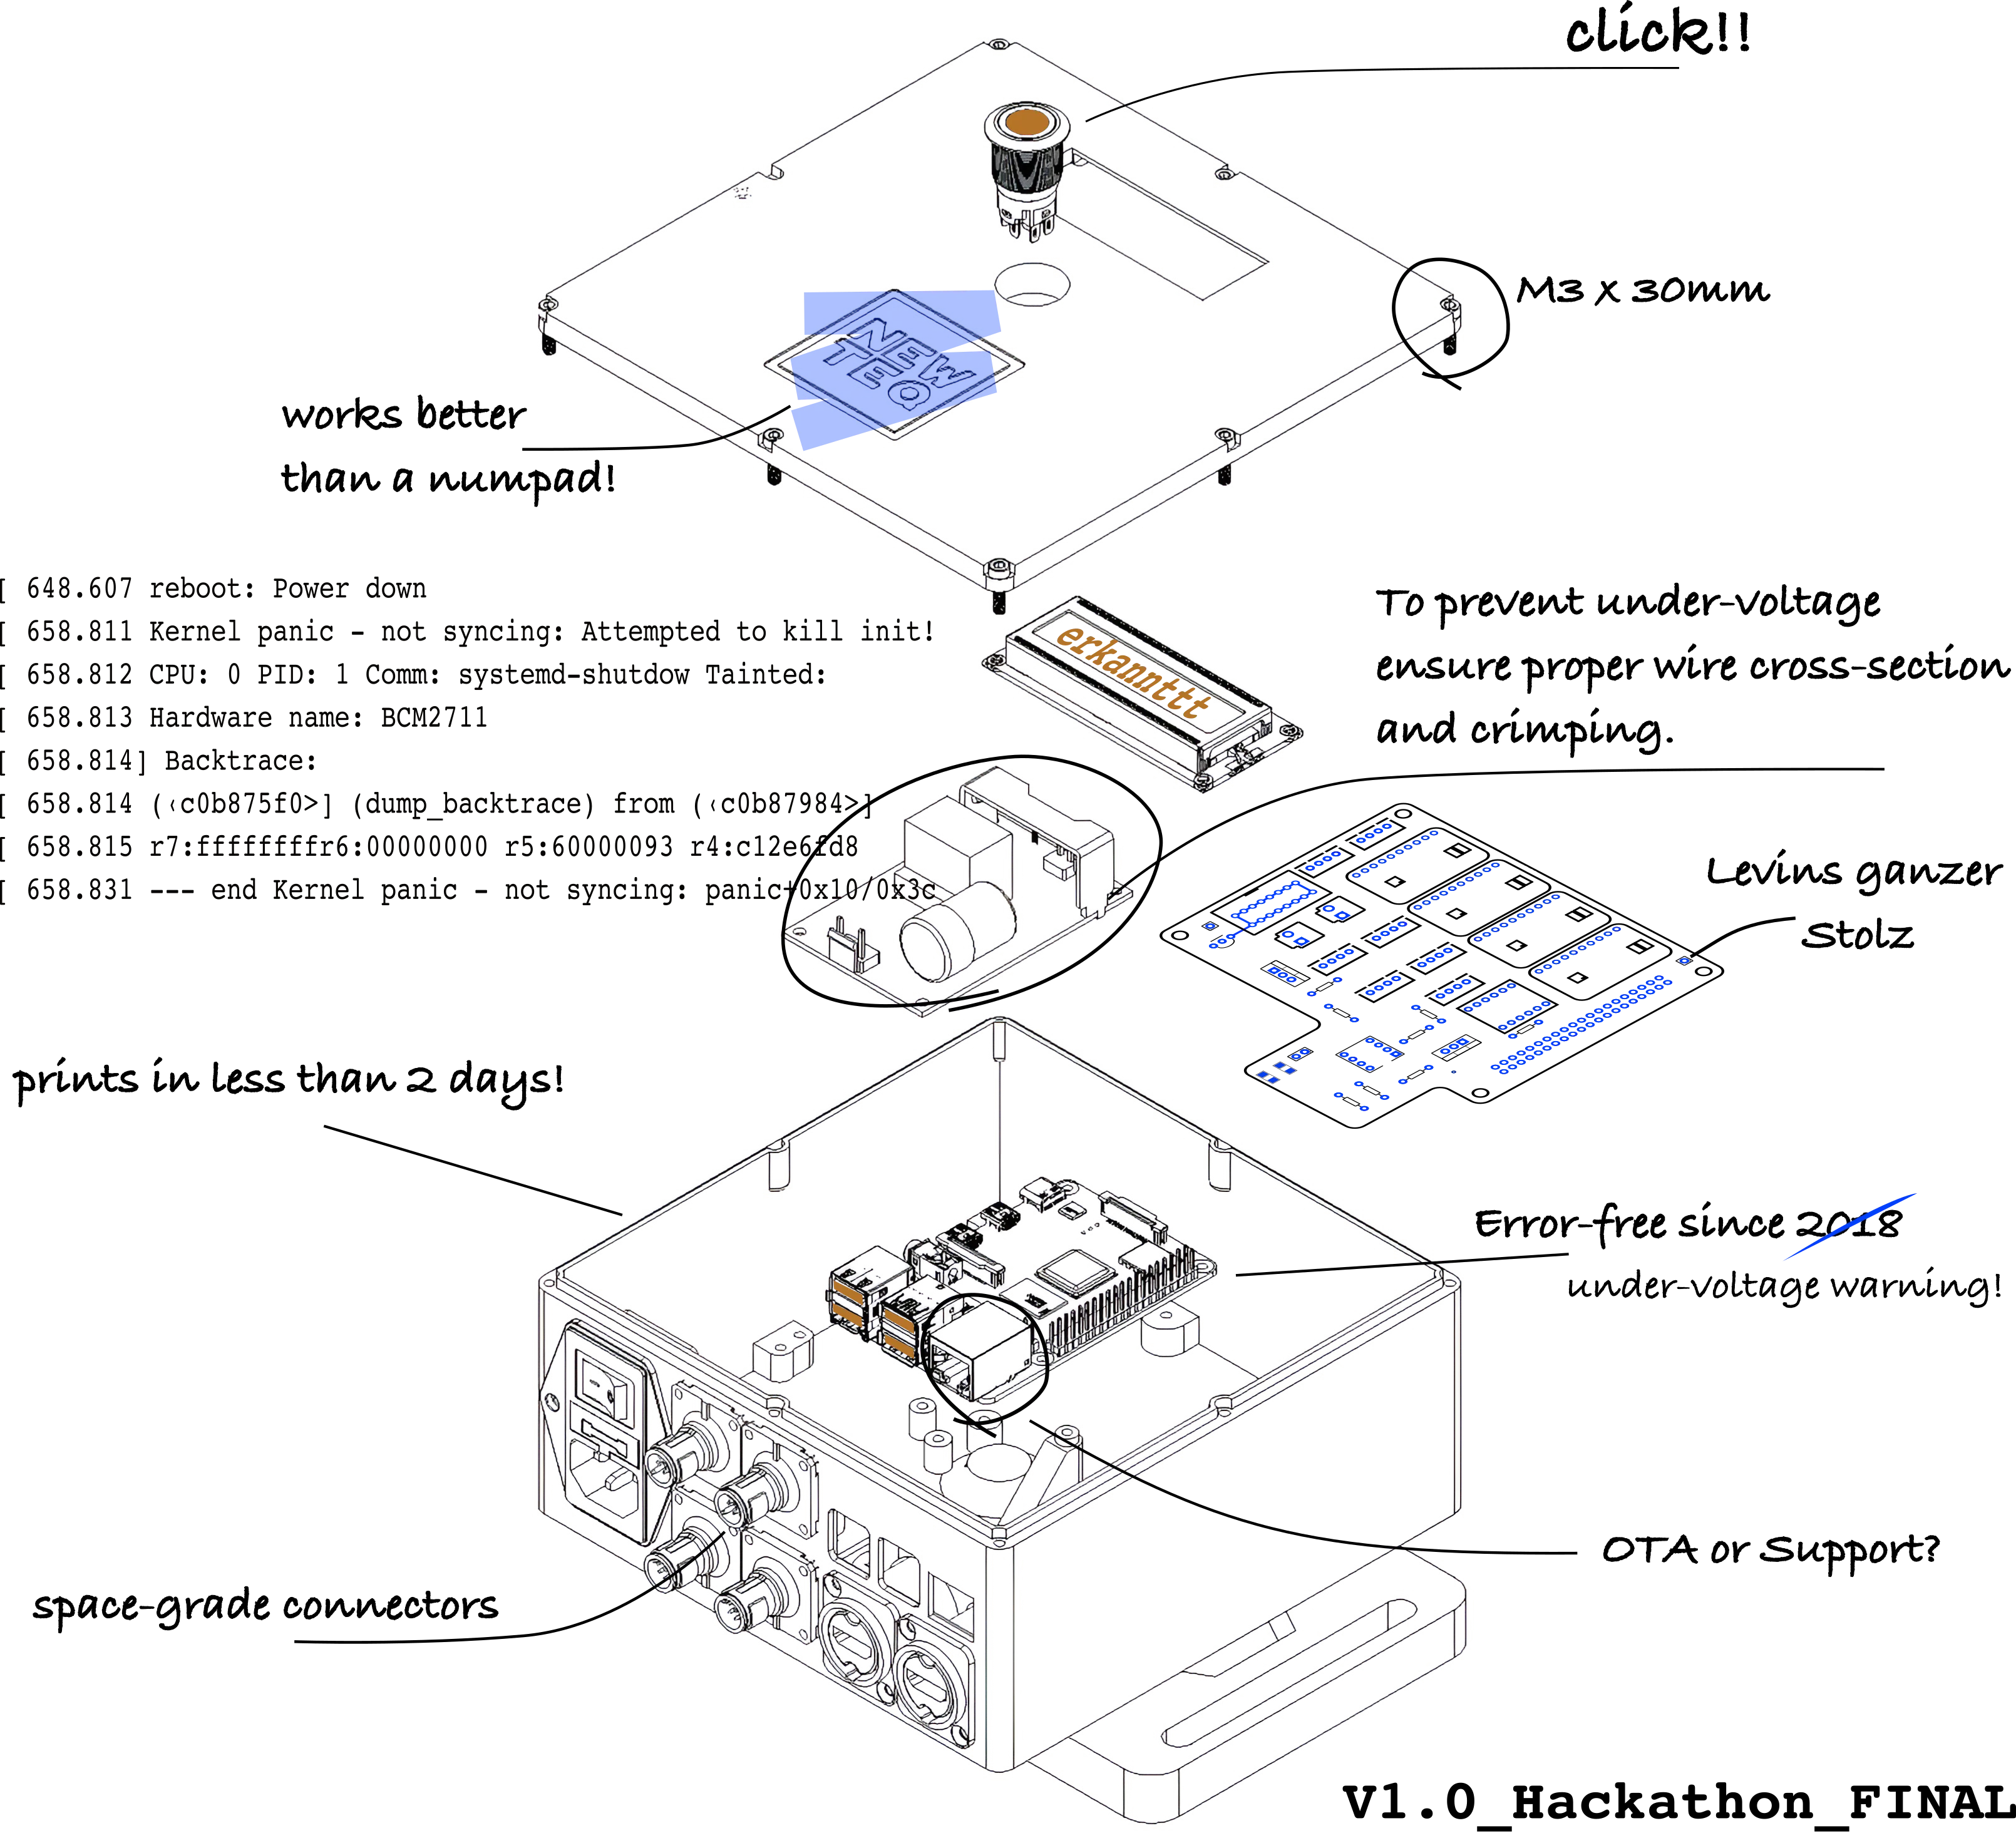
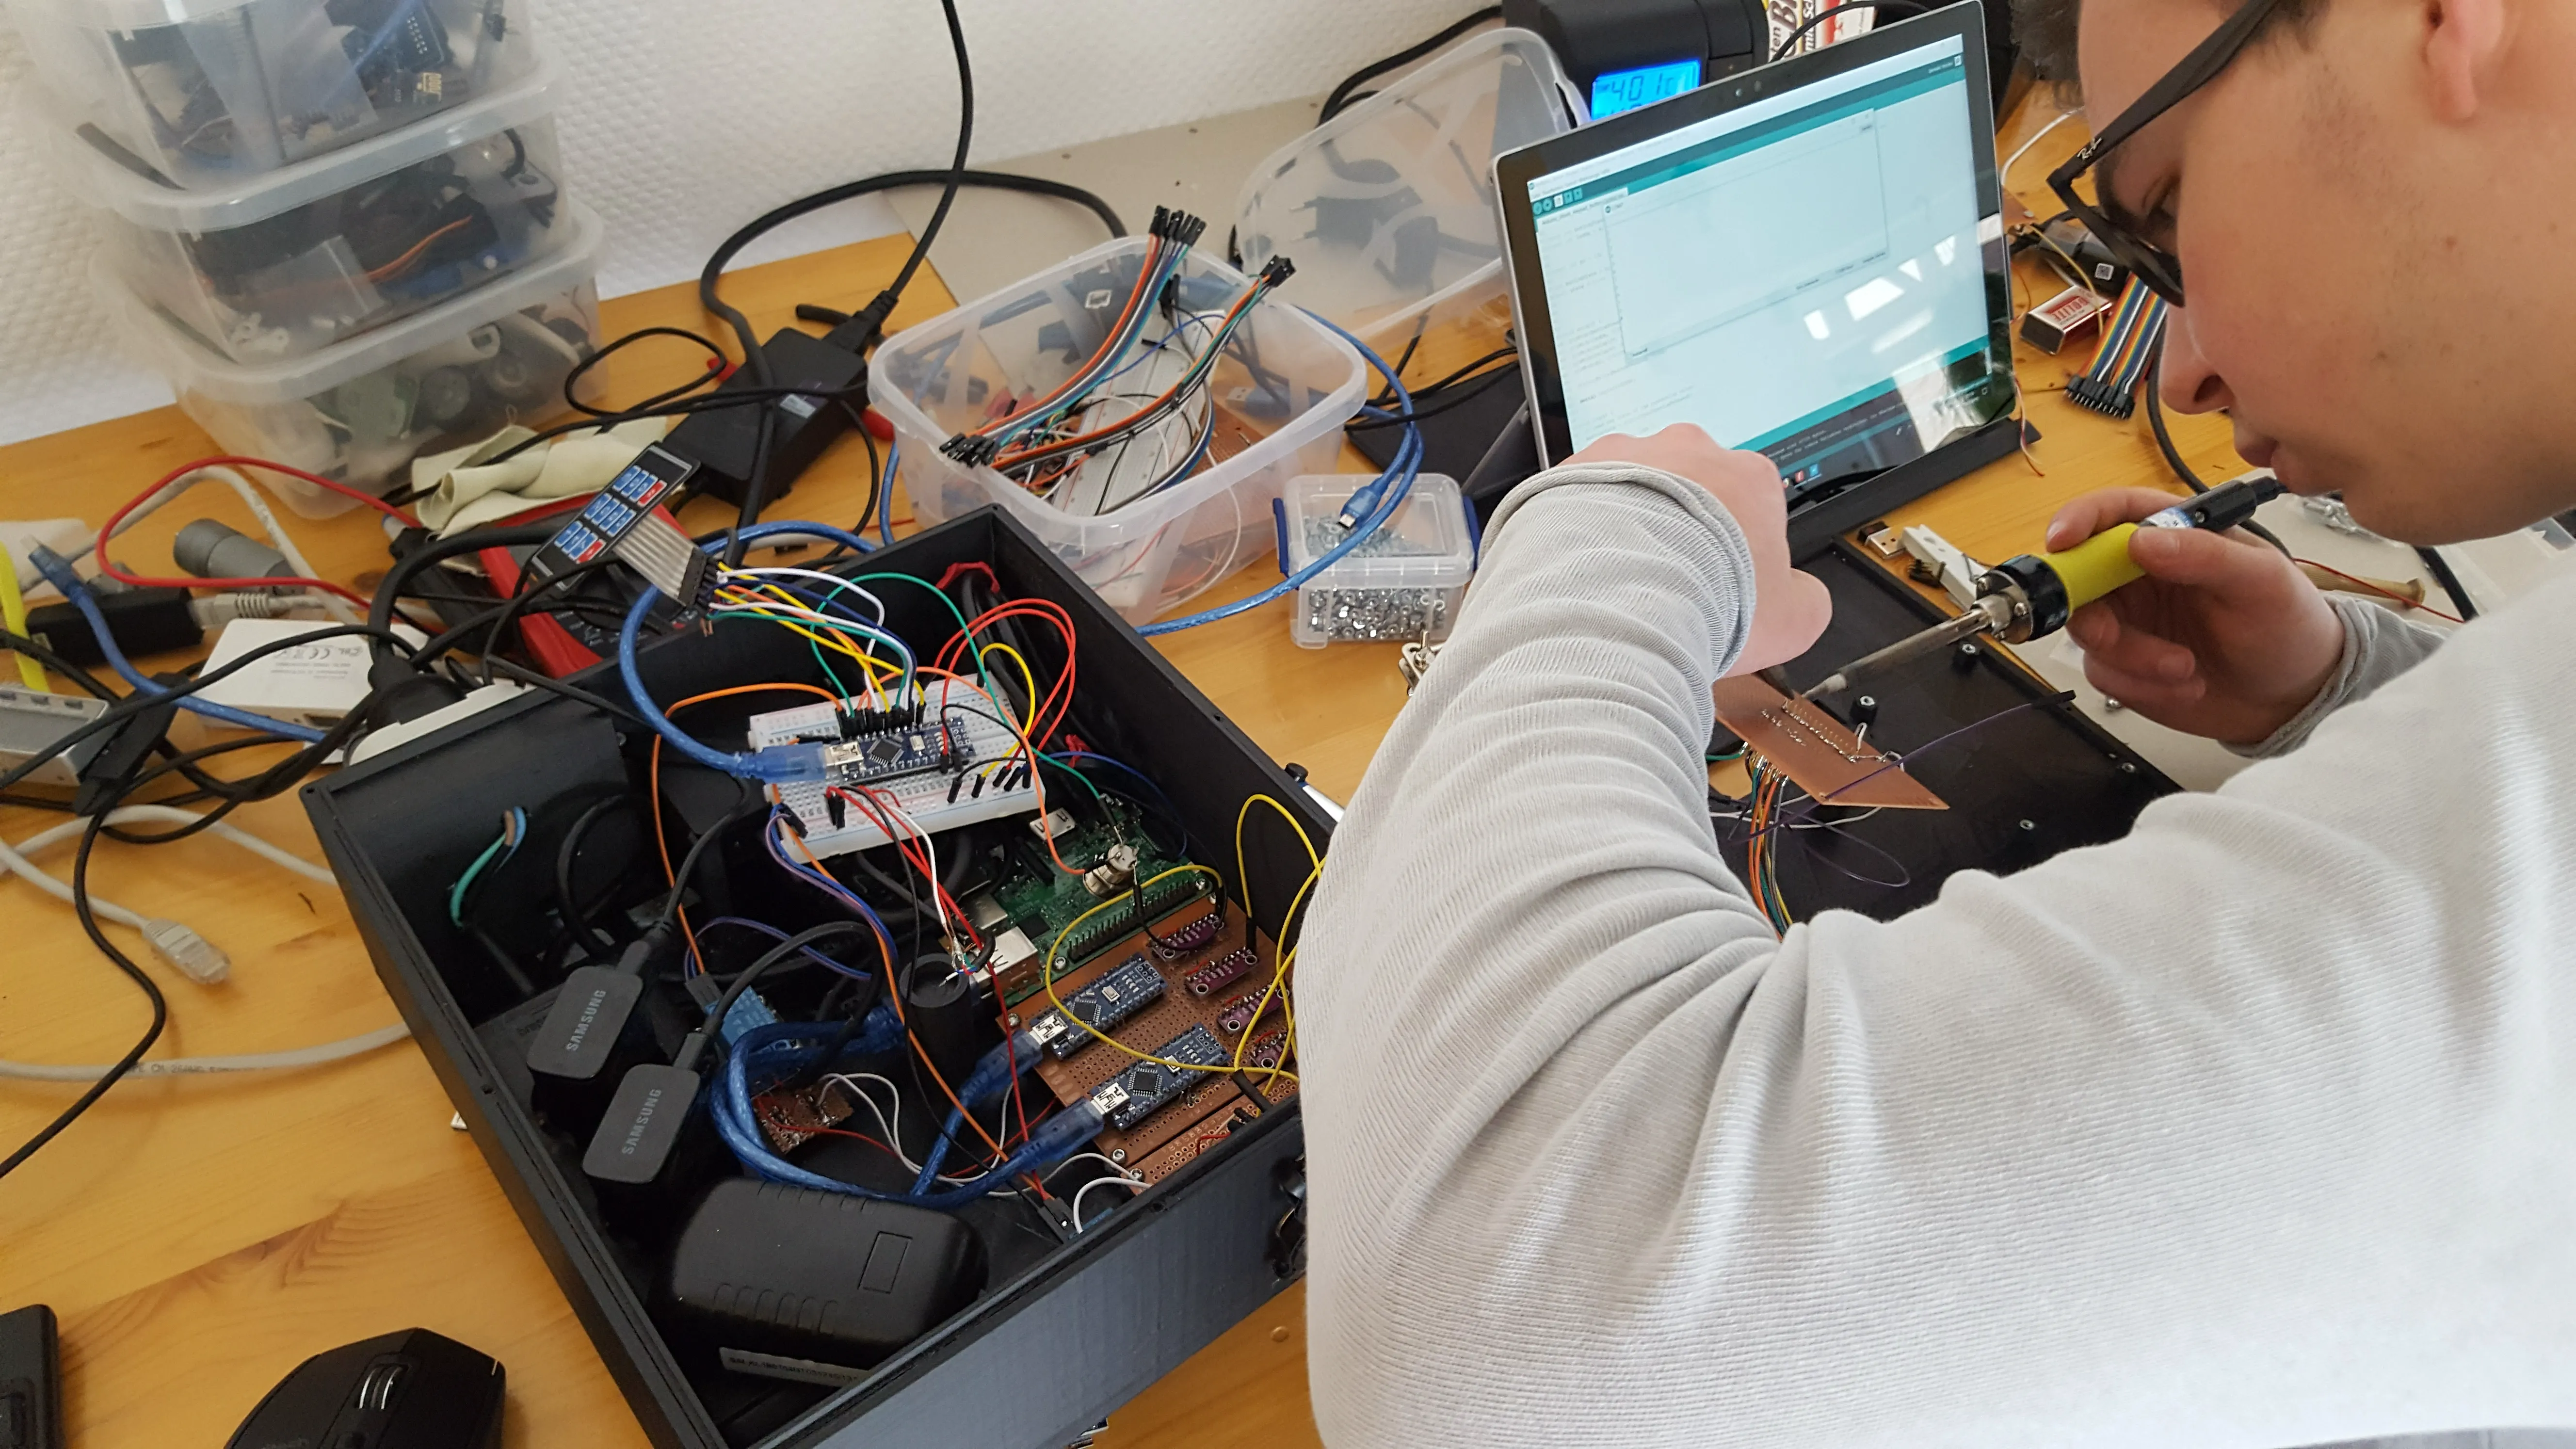
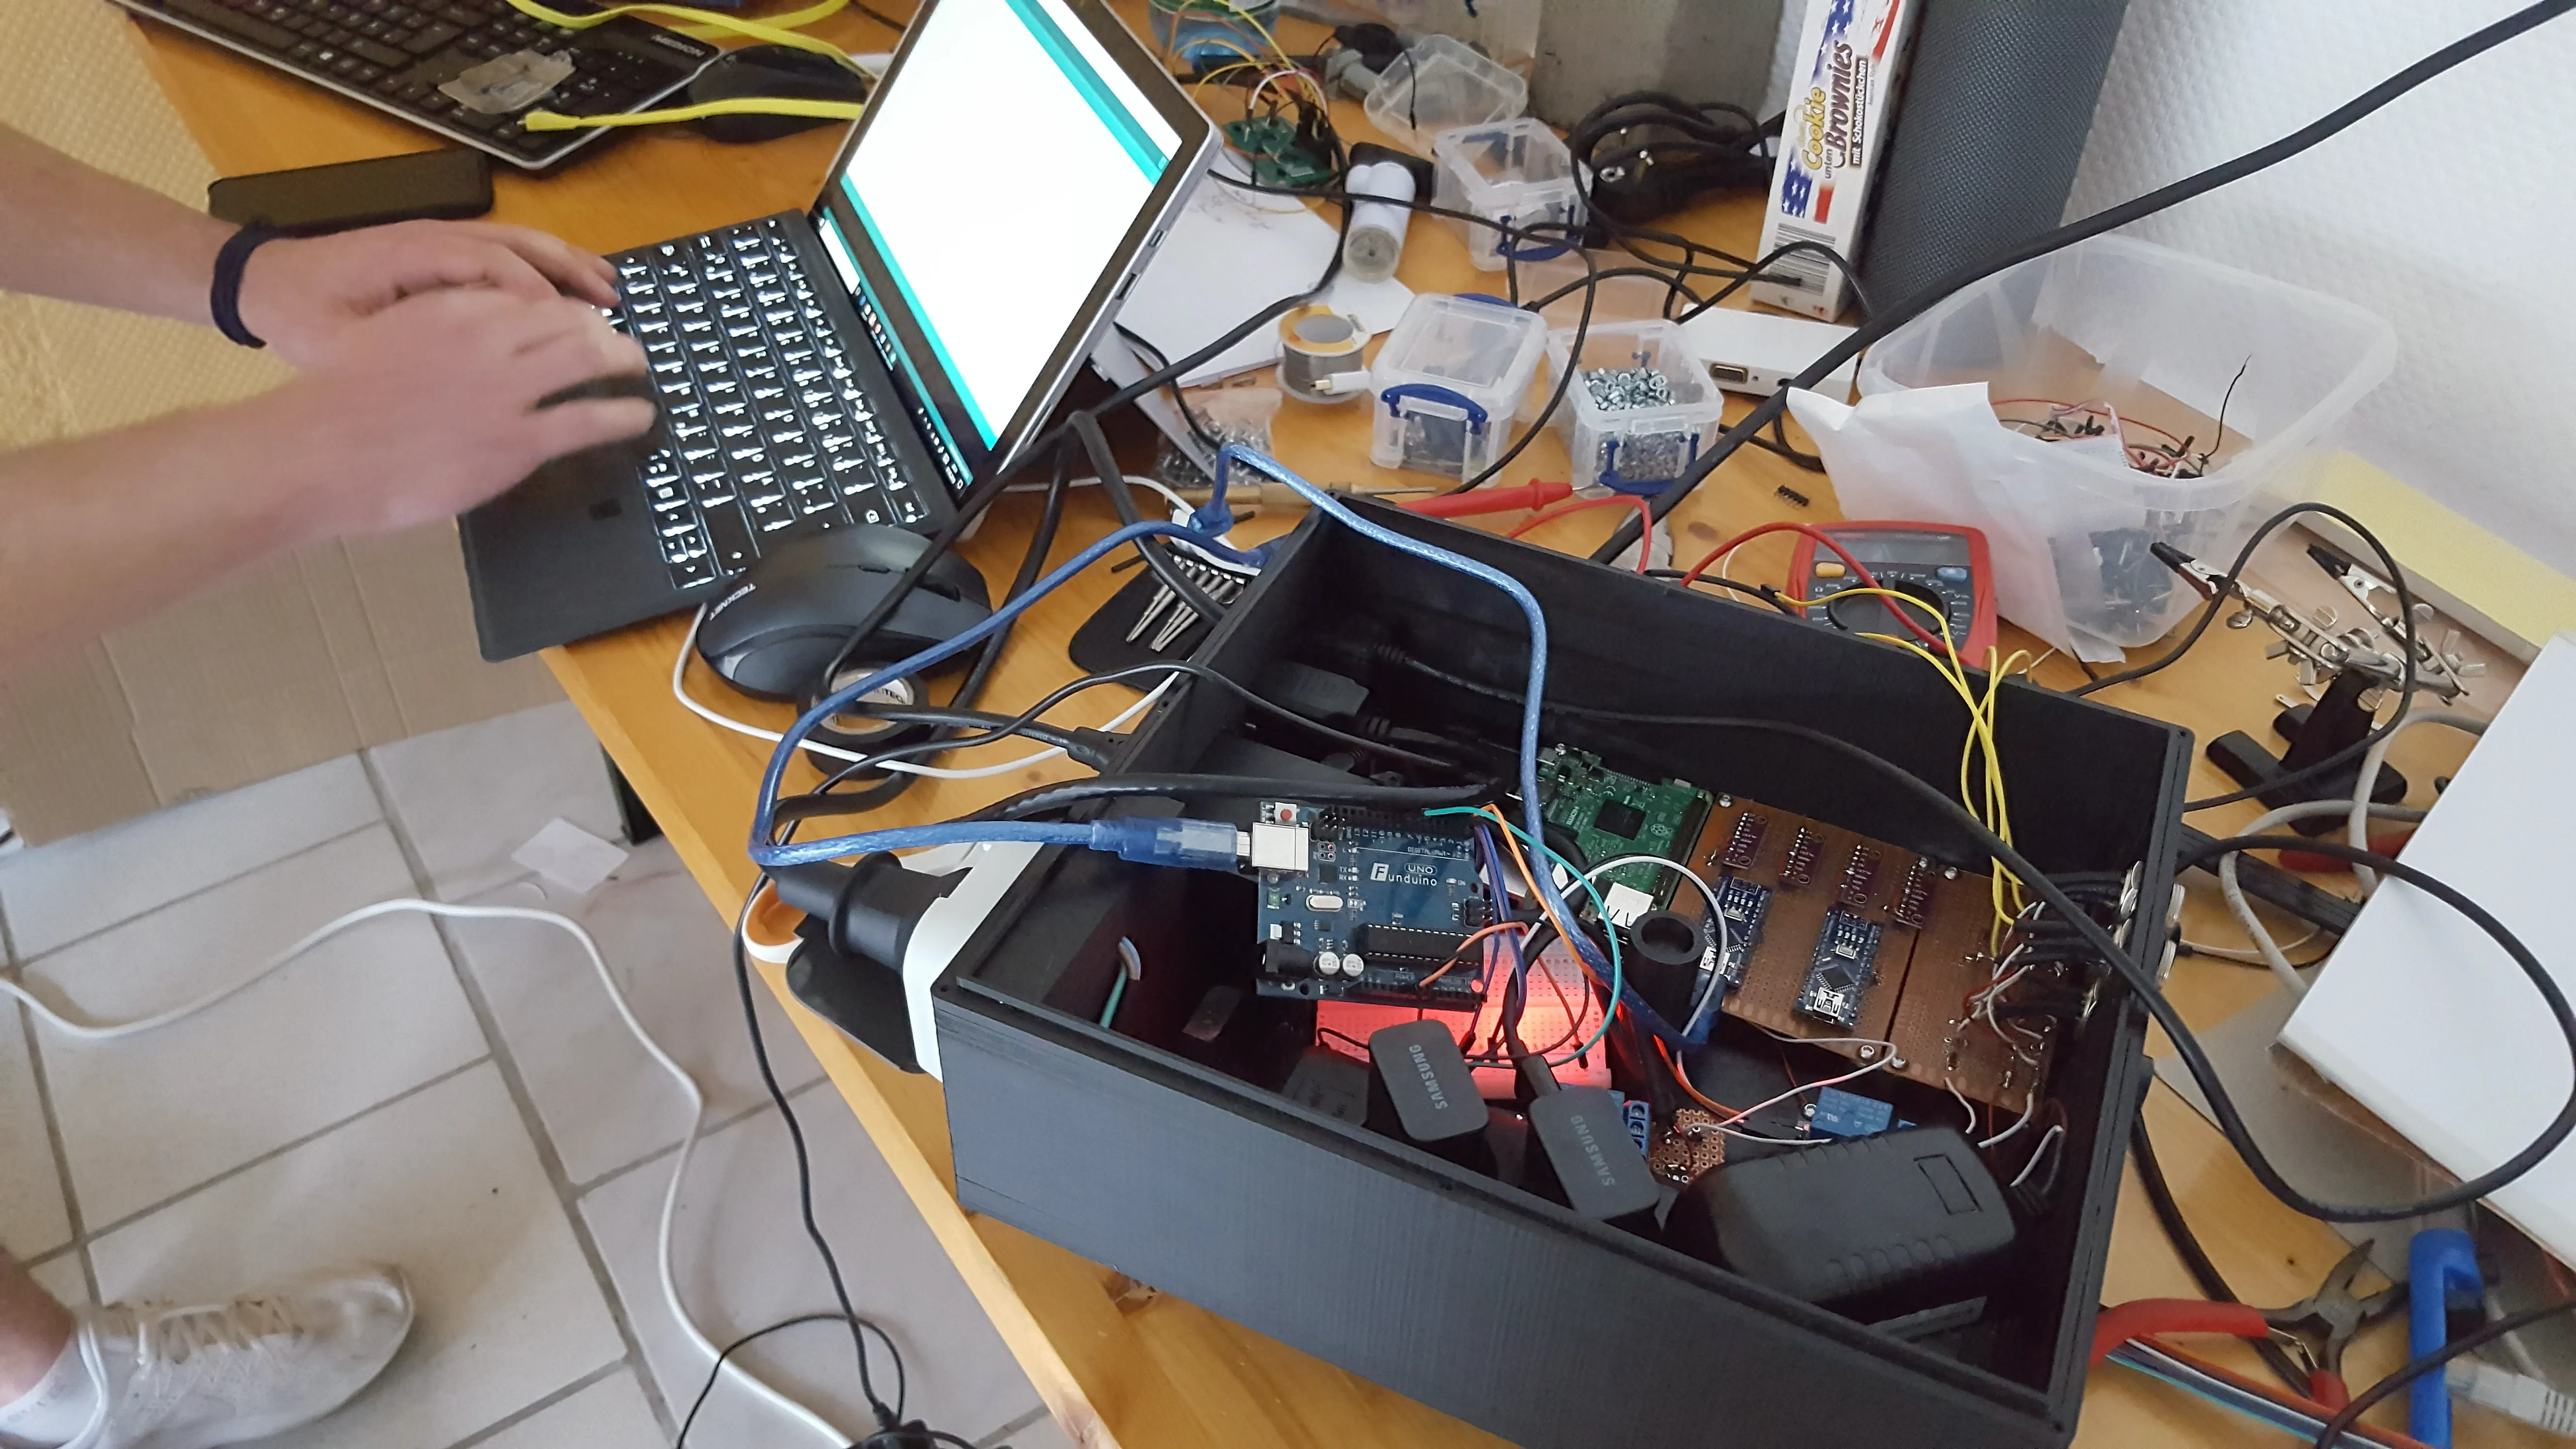
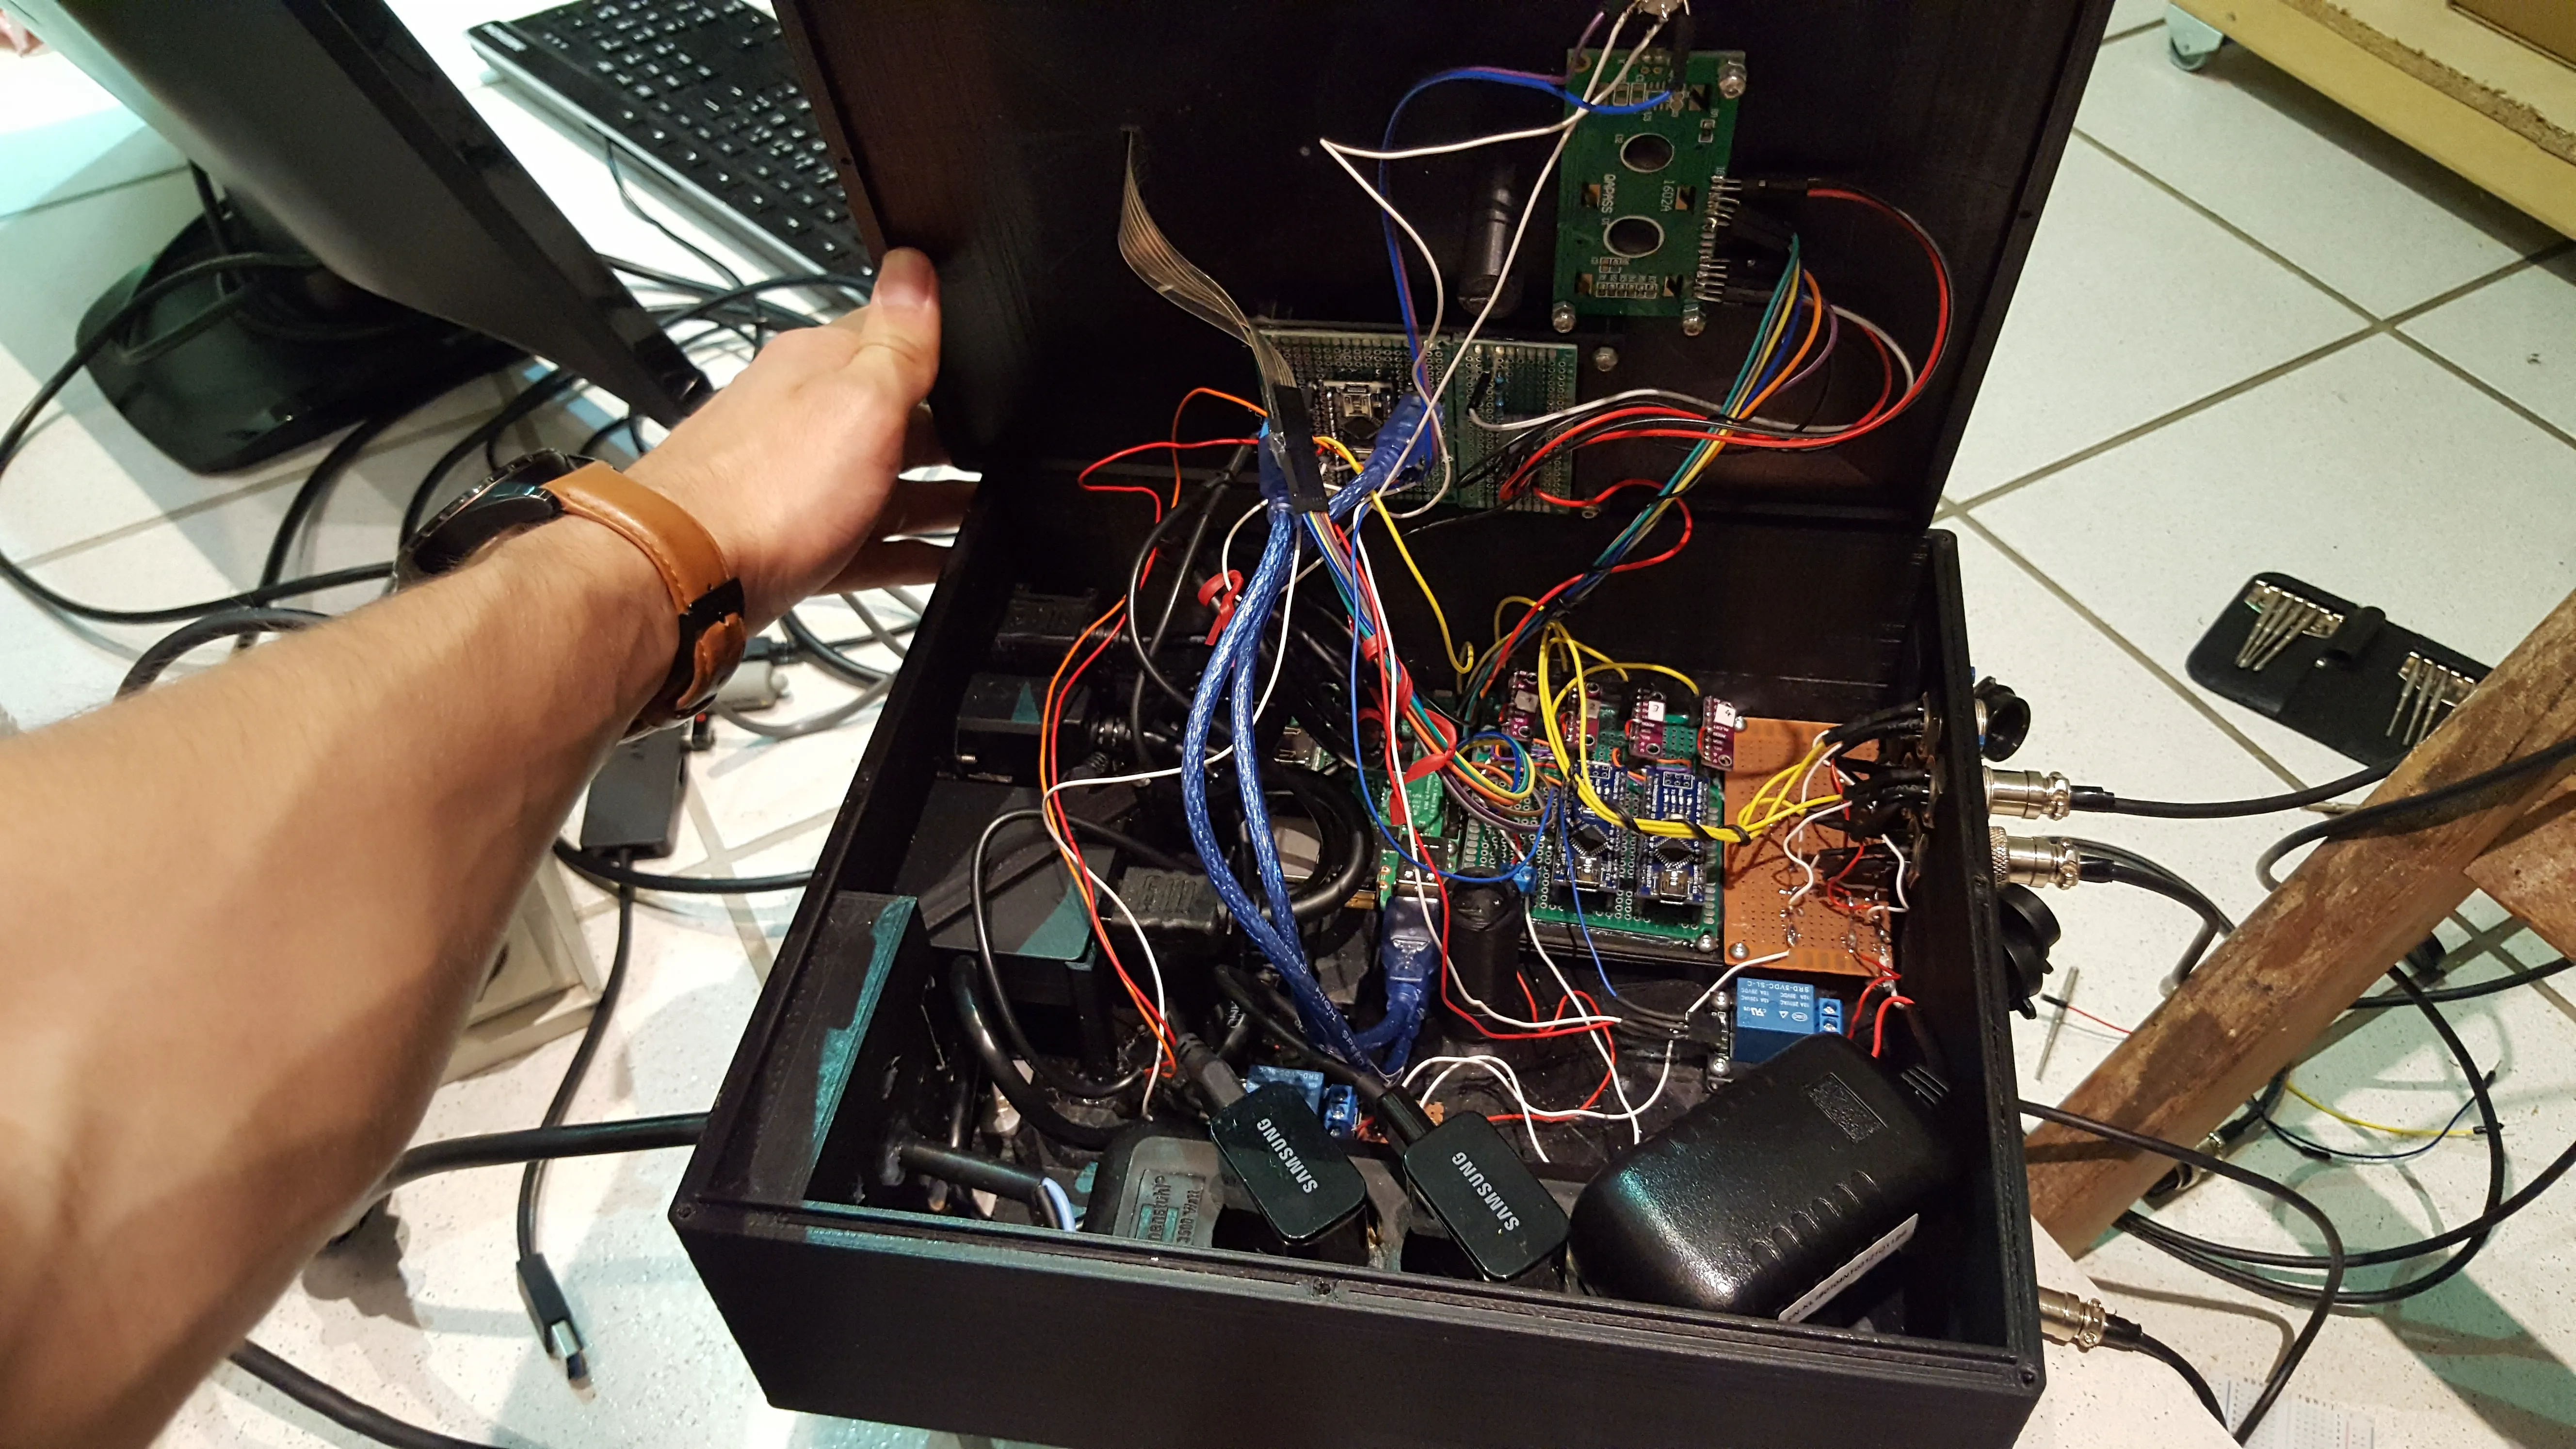
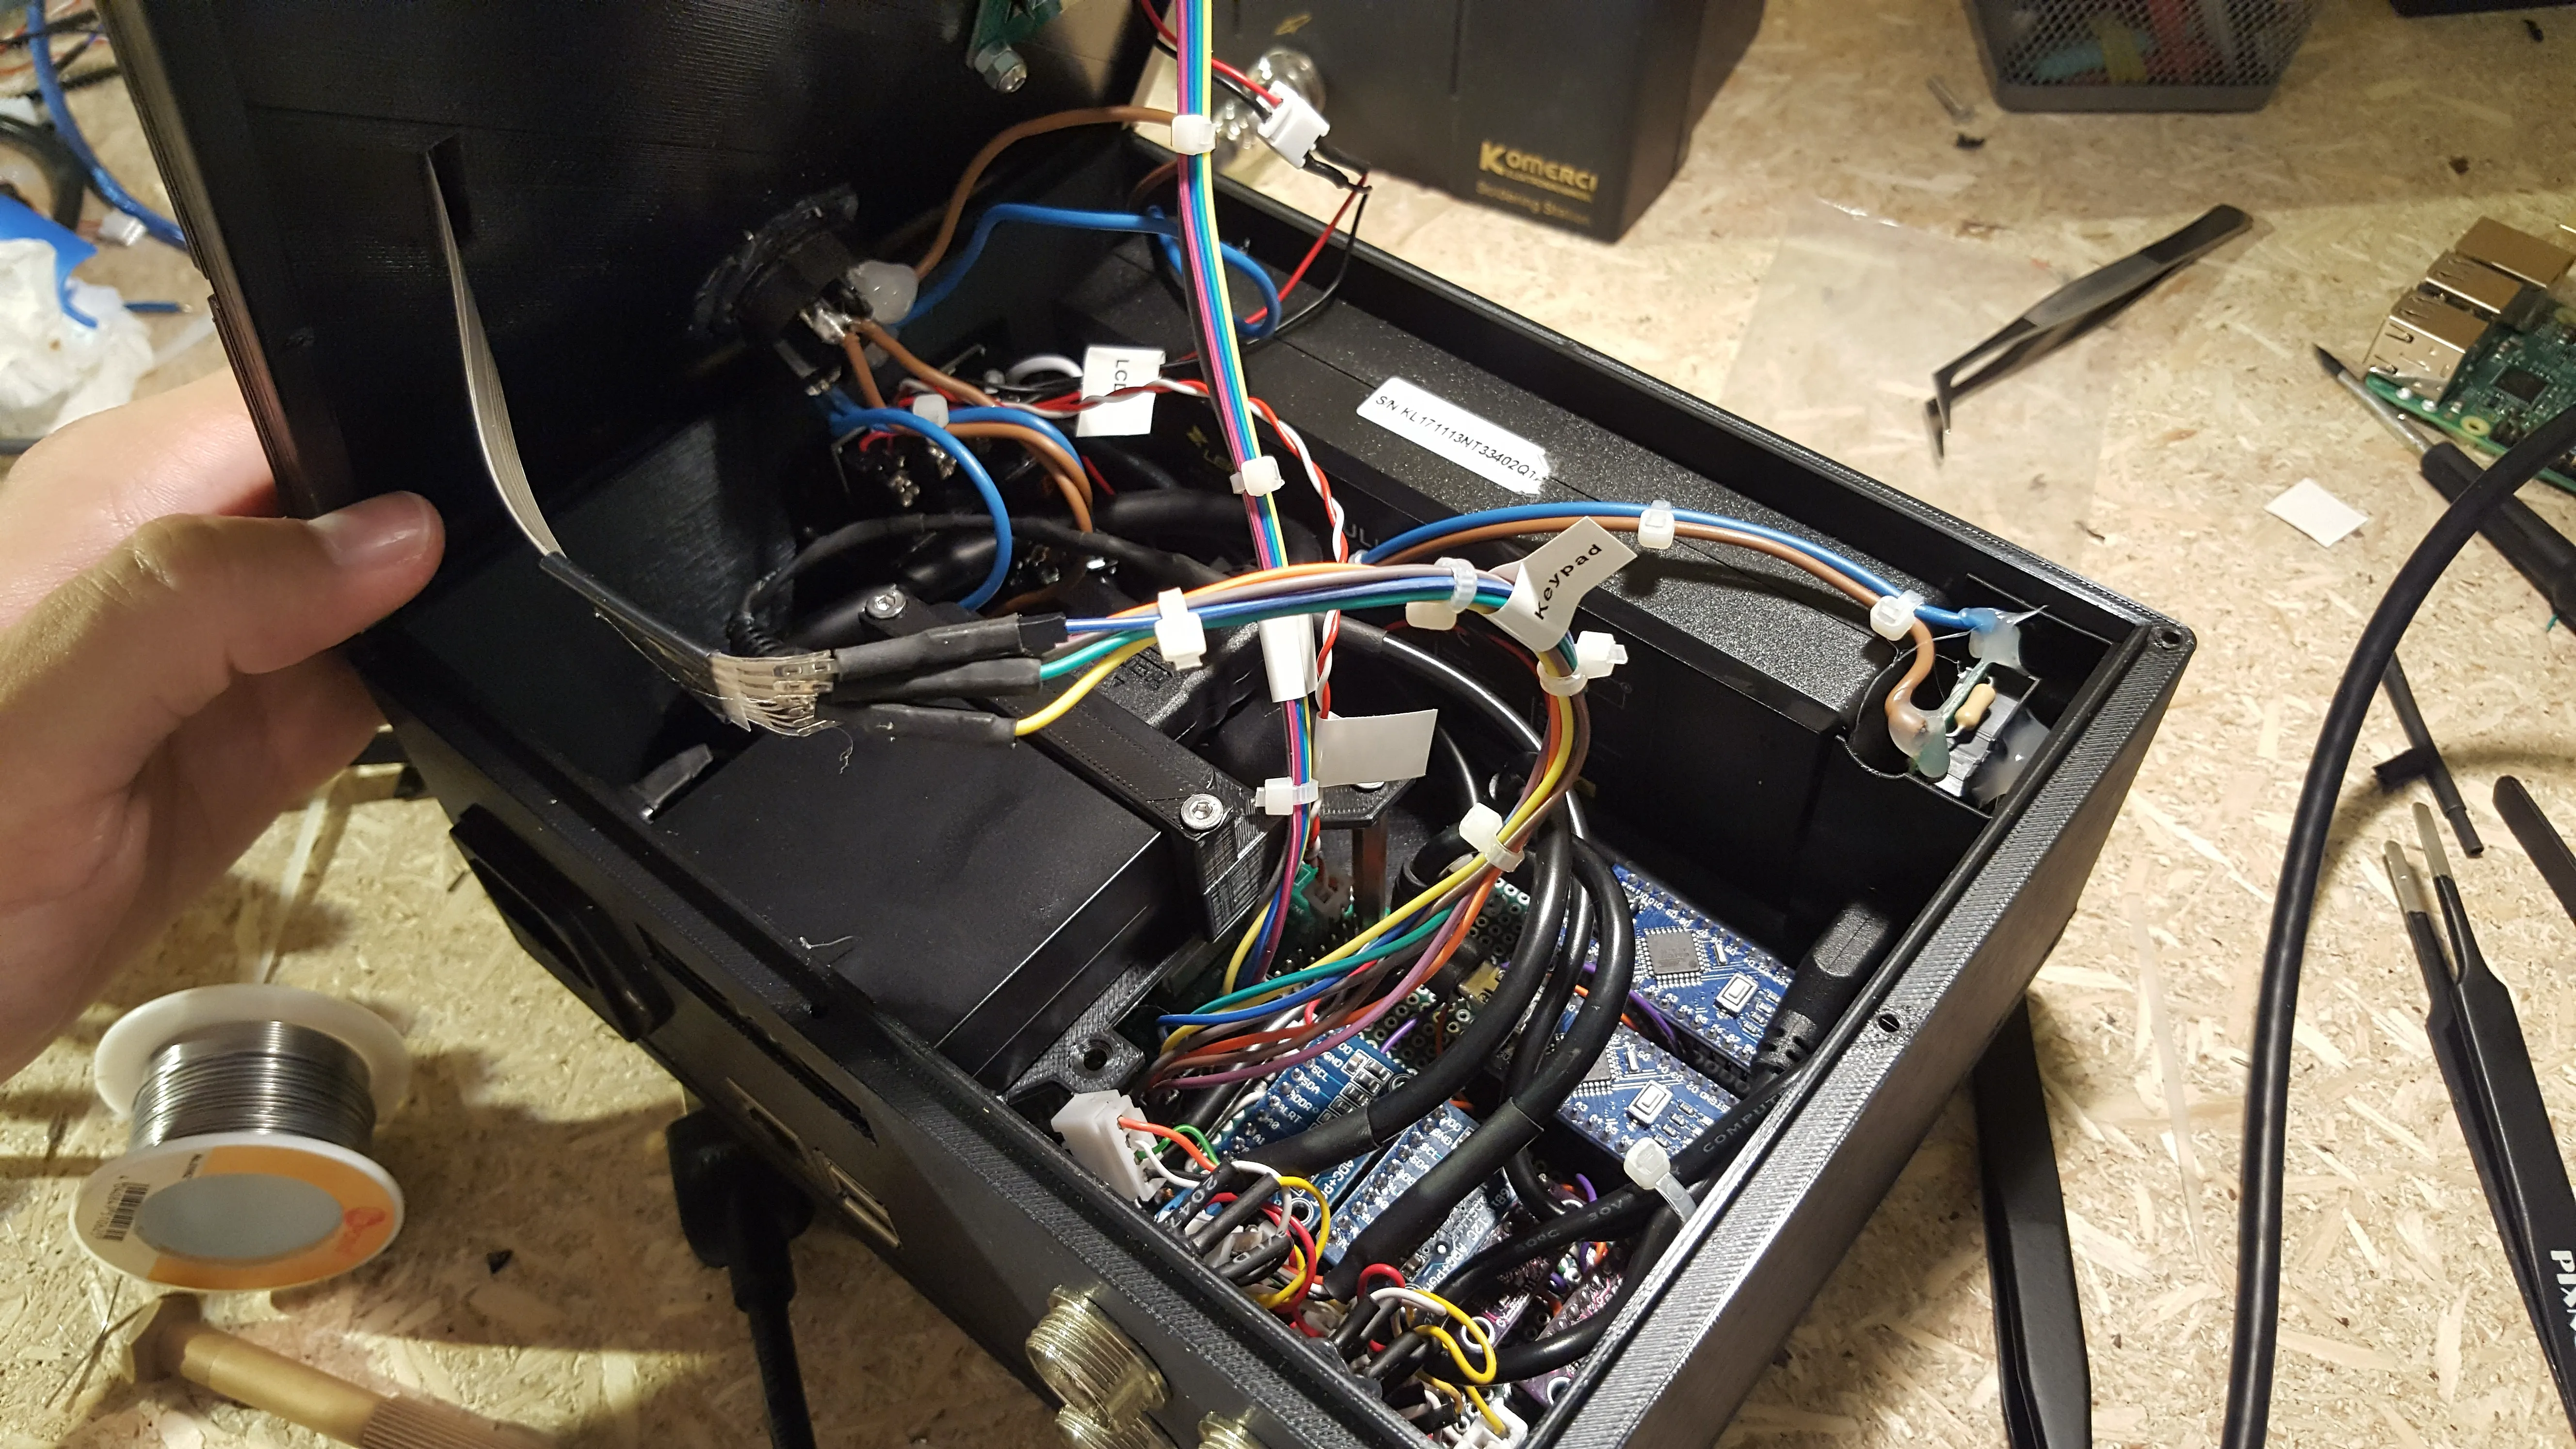
We started this project with very little experience in industrial product design and quickly realized that we had to think about the small but critical details: what kind of bolts to use, so the housing wouldn’t loosen from vibration; what industrial connectors would be robust enough for daily use; how components should be arranged inside the housing for easy access and good airflow; and which parts we could reliably source and replace if needed.
For housing and mechanical parts, we relied heavily on 3D printing. That meant learning a lot of hard lessons quickly. We had to deal with tolerances, structural strength, and issues like how to incorporate threaded inserts to make repeatable and durable screw mounts. We also needed to account for the harsh, dusty, and vibration-prone environment in which the components would operate.
On the electrical side, our first design was drawn up in Fritzing and built by hand on a perfboard. Still, it worked. We built a custom circuit to manage power delivery to the sensors and to the Pi. At the time, Raspberry Pis didn’t have a dedicated power management header, so we had to use the GPIO pins along with a custom script to control startup and safe shutdown. It wasn’t elegant, but it gave us control and protected the Pi from unexpected power cuts. Eventually, we moved to a custom PCB, which dramatically improved the reliability and ease of assembly. It also made the internal wiring neater and more maintainable.
Thanks to our earlier cocktail machine project, we already knew how to get a Raspberry Pi running Java to talk to external hardware. We just needed to understand the new sensor’s communication protocol — and after a bit of digging through datasheets and experimenting, we managed to get consistent readings.
The Software - Processing & State Machine
The software turned out to be the most complex and intellectually demanding component of the project for me. The system needs to process approximately 2600 sensor values per second on a Raspberry Pi without active cooling, as fans are unsuitable in the facility's extremely dusty environment. That means we had to be careful with CPU usage to avoid overheating.
To accomplish this, the system's architecture is layered for clarity and extensibility. At the lowest level, C programs read each sensor at 660 samples per second. With 4 sensors, that’s roughly 2,640 samples/s total. A microsecond-level correction keeps each stream’s sampling period stable. These values are then fed into a Java program that runs a multithreaded state machine, with each sensor running in its own thread. Threads operate independently during normal operation but synchronize at defined events, such as the end of a brick batch.
Events are emitted through a listener architecture, which allows us to decouple sensor processing from user interface logic. They are triggered by a custom edge-detection algorithm on the sensor stream to segment continuous data into per-brick and per-board windows. These windows are then further cleaned up by removing outliers and ensuring that the data is continuous. Finally, the data is processed to determine the brick height.
Determining the brick height requires calculating the relative height of each brick from the baseline of the underlying board. This includes accounting for damaged or partial bricks and ensuring that outliers do not crash the processing chain.
The clean output of the listeners is further used to trigger a watchdog timer, automatically update the target height of the bricks and display the data in the user interface.

User Interface
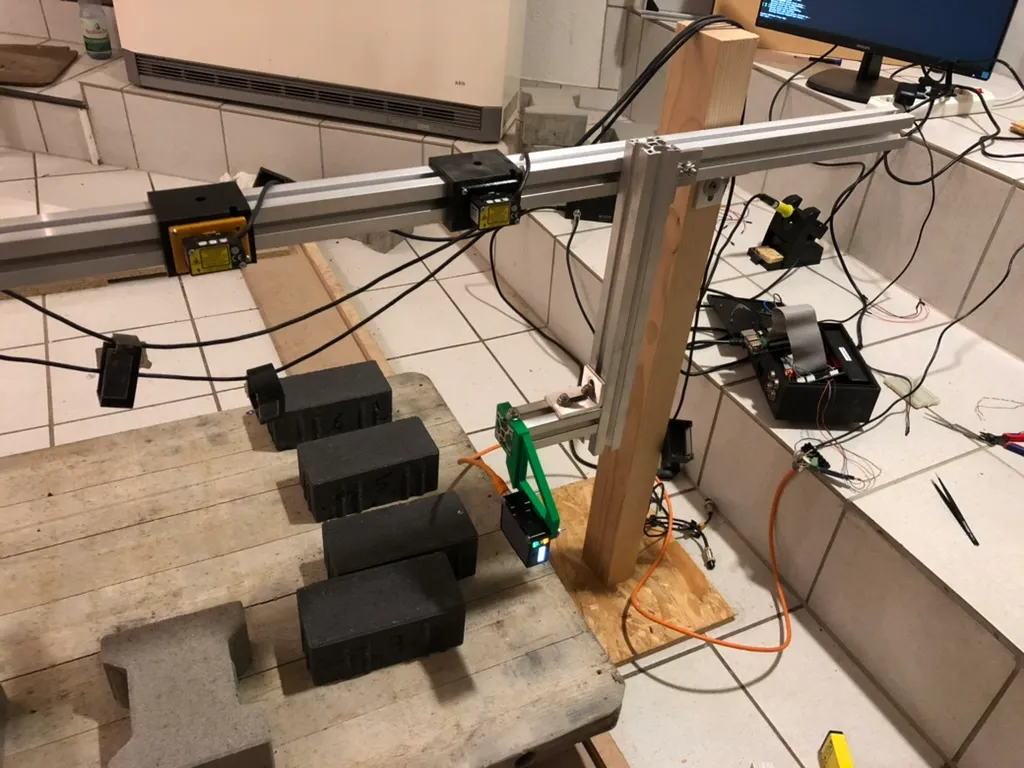
The graphical user interface, built using JavaFX, initially visualized data as a continuous height graph (see first image below). While technically accurate, this proved difficult for factory operators to interpret. After user feedback sessions, we redesigned the interface to highlight only the relevant information: individual bricks and their measured heights, presented in a grid layout equivalent to the production line.
In this visualization, bricks that meet height specifications are marked green, while deviations appear in yellow or red. This intuitive color-coded view allows operators to quickly assess whether a batch is within tolerance and also helps them detect systematic production errors, such as uneven extrusion, enabling timely adjustments to the brick press.
Developing a Simulator
After deploying the initial prototype, it became evident that the factory environment introduced numerous edge cases that were not accounted for in our lab testing. Damaged bricks, sensor misalignments, foreign objects, and operator interference all created scenarios that could cause the system to behave unpredictably or even crash.
To address these challenges without requiring constant presence on-site, we developed a simulator. The simulator mode allows the software to start with simulated sensors that replay recorded sensor data as if it were live input. Now we were able to capture real production measurements during on-site visits and use it to test the software in the comfort of our own lab — enabling realistic and repeatable testing in development.
We also implemented a black box logging system, which continuously records sensor values in a rotating buffer and preserved the last ten minutes of readings upon encountering a critical error. This allows for remote debugging and analysis without physical access to the factory.
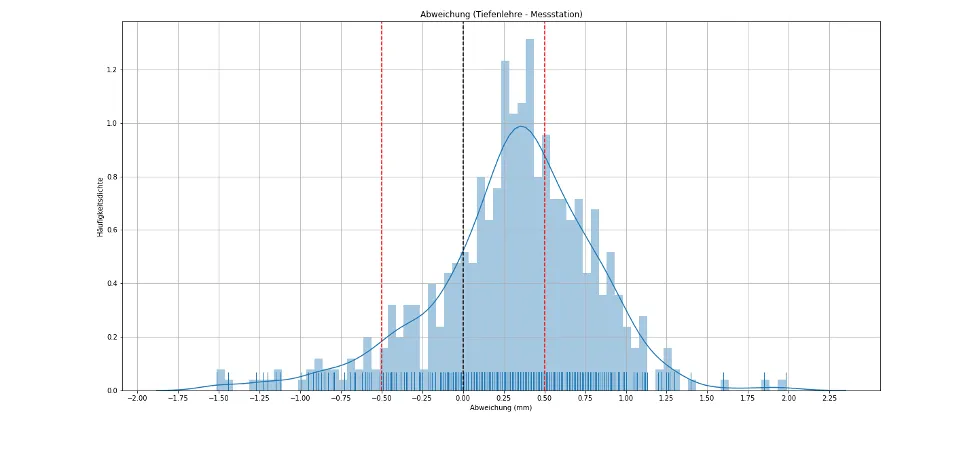
Diagnosing Precision Issues
A few weeks after launching the system, we began receiving troubling feedback: the height measurements captured by our software didn’t match what the factory operators were seeing manually. The results weren’t just off—they were unreliable. This was a critical issue, especially in a production environment where millimeter-level accuracy matters.
It was around this time that my brother, Tiago Afonso, joined the project, bringing our core team to three. Together, we dove into an intense debugging phase that lasted several weeks. We pulled all-nighters reviewing every aspect of the system — software logic, mathematical models, state machines, everything. Our initial suspicion was that the software itself was flawed. We refactored large sections of the code, added more granular logging, captured production snapshots for local testing, and even studied academic research on industrial sensor calibration. Every angle was explored. But despite all the effort, we kept arriving at the same conclusion: the software was working as intended.
The real problem, as painful as it was to admit, lay with the sensors.
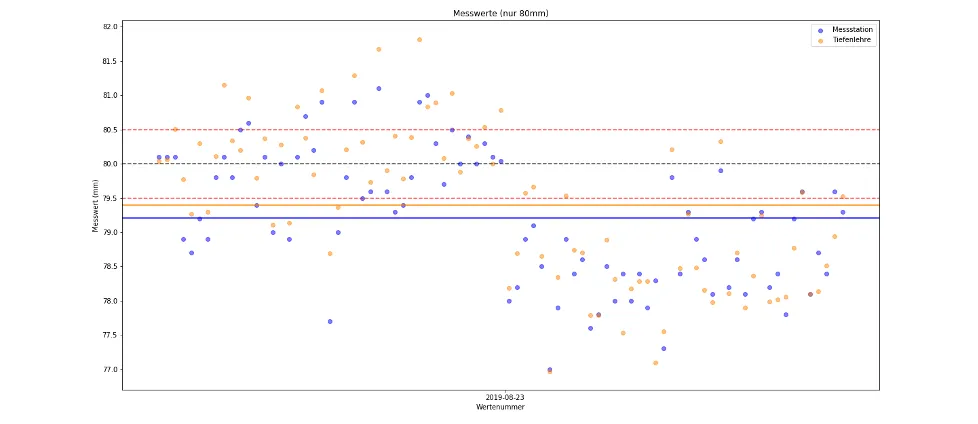
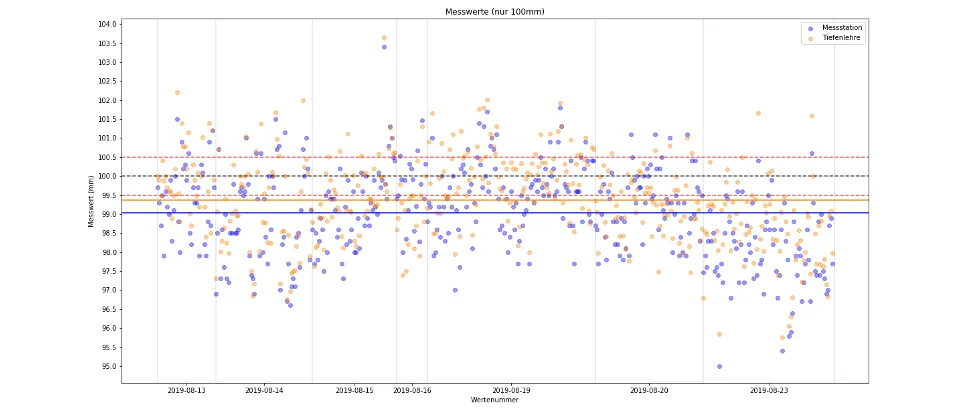
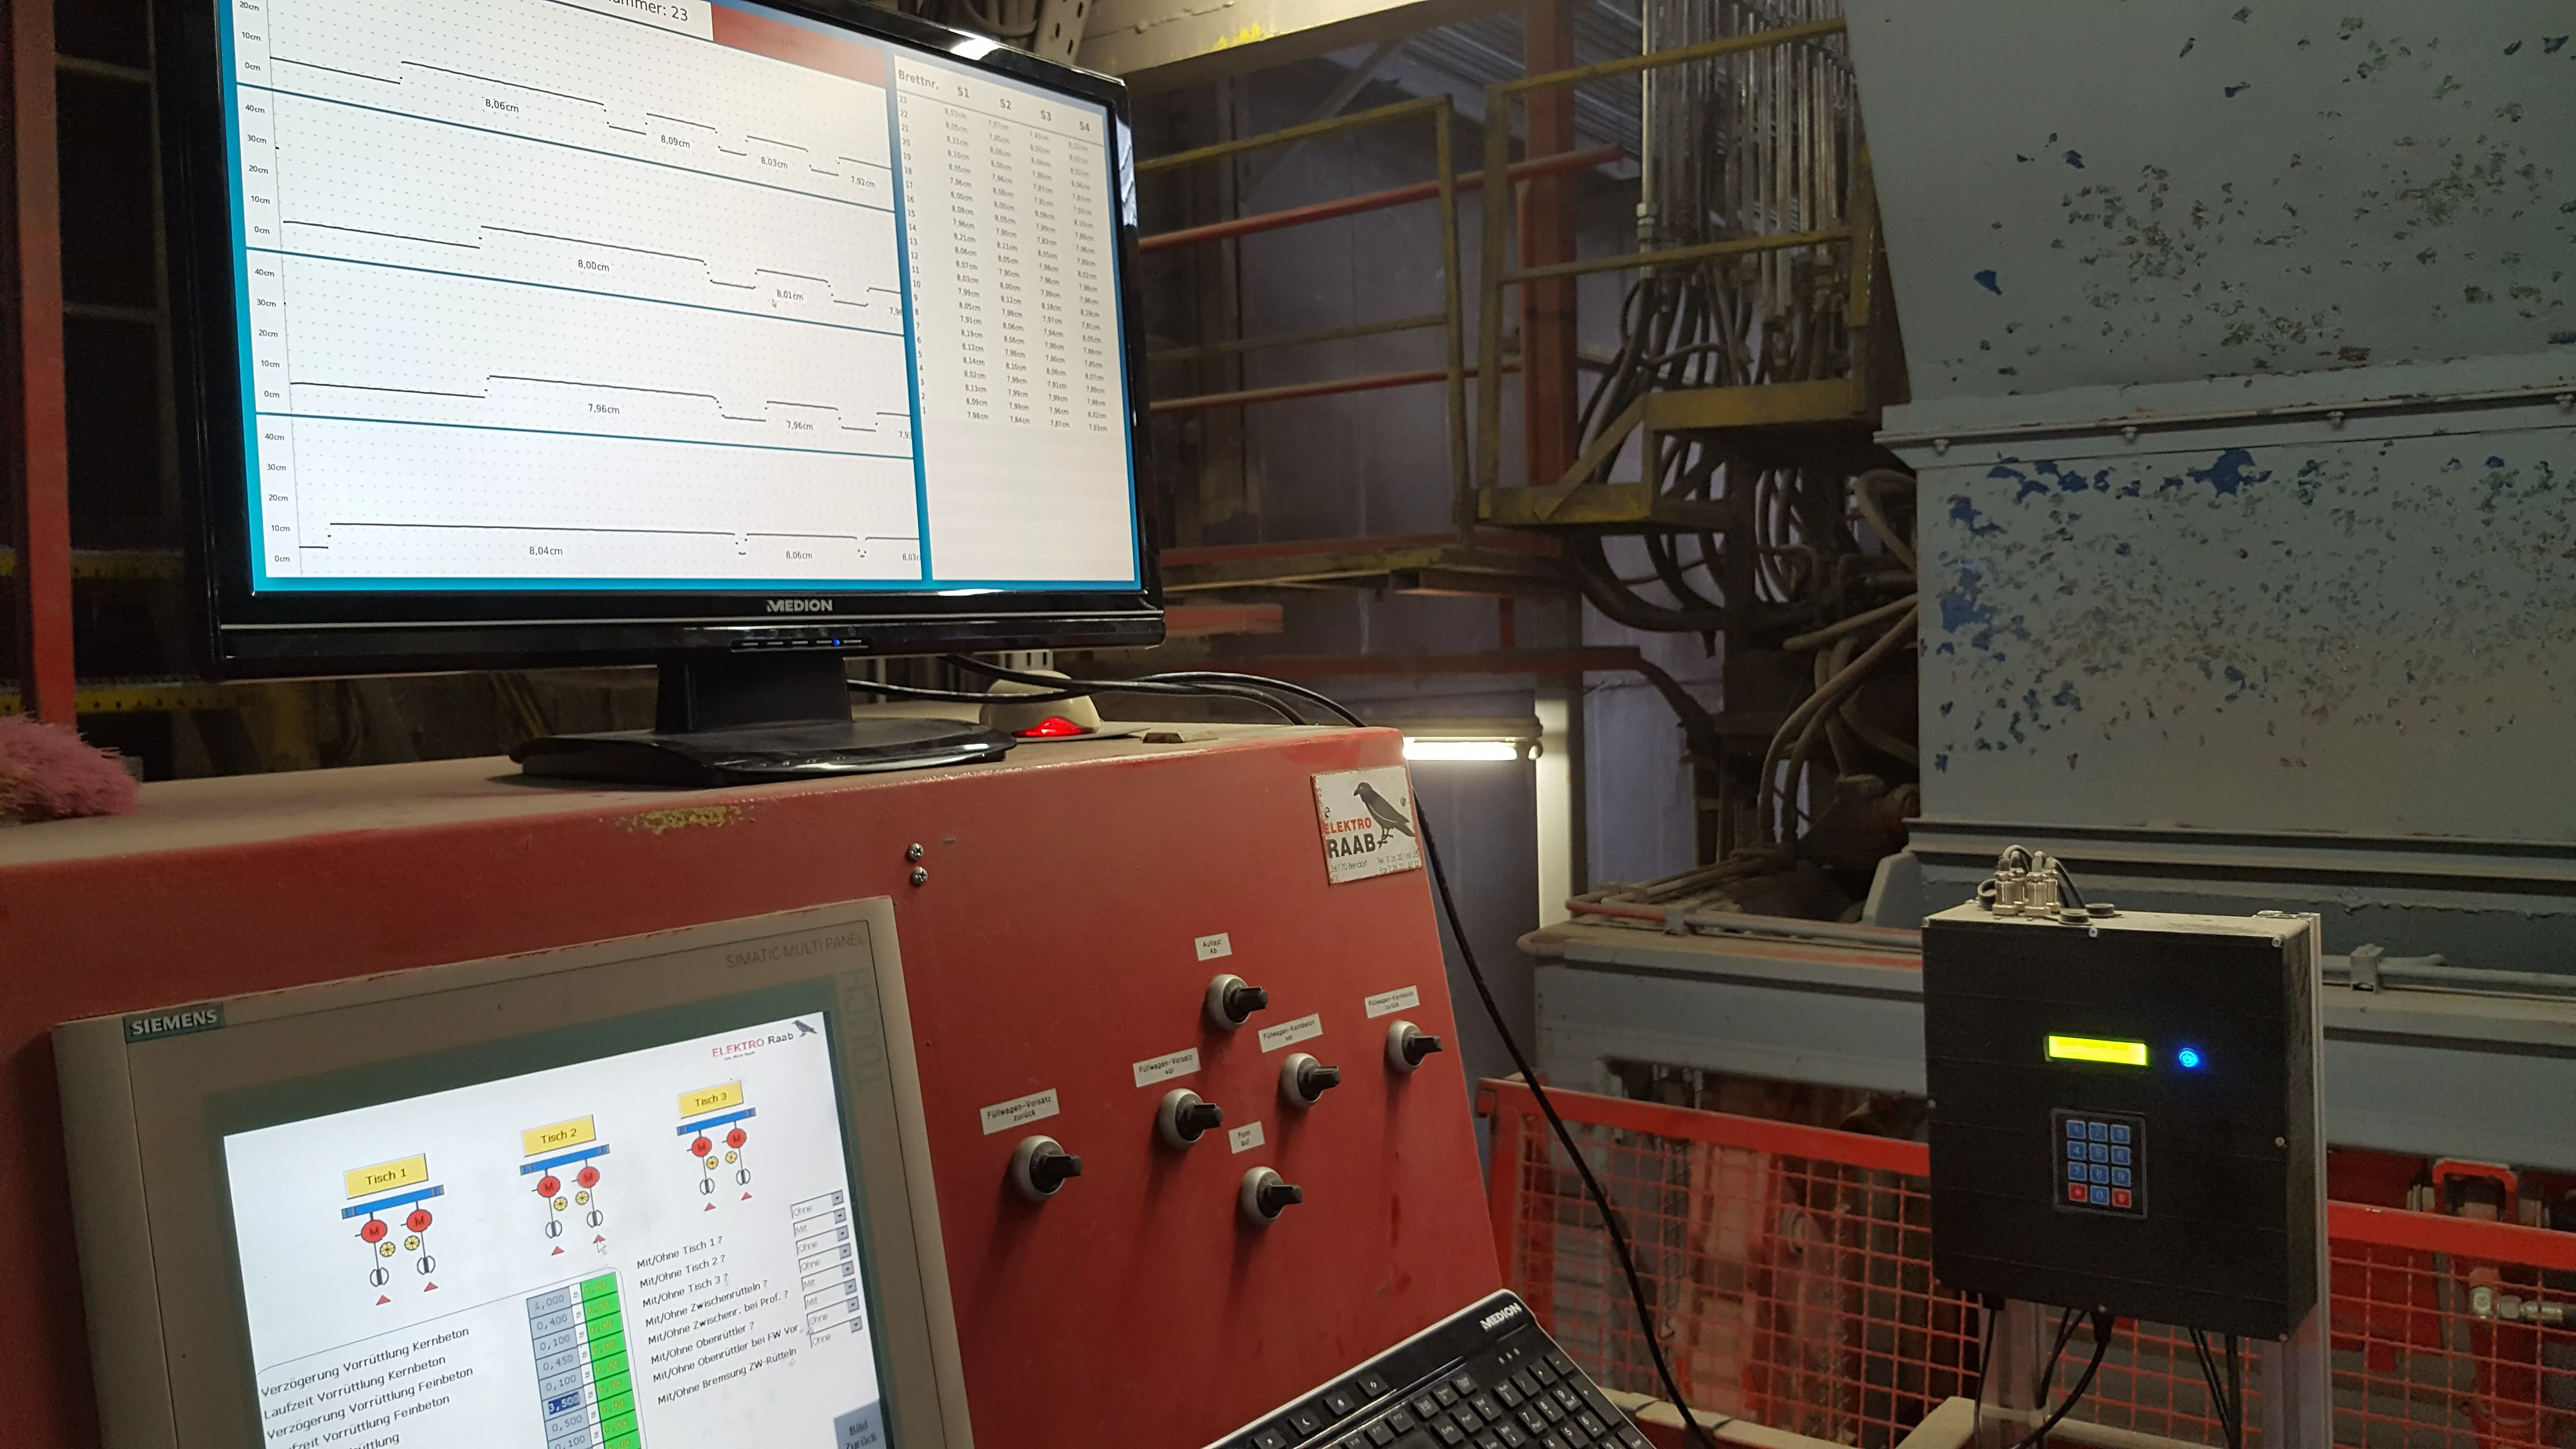
To be absolutely certain, we decided to verify everything with real-world data. For three weeks straight, we visited the factory daily, before driving to college. We manually measured the height of bricks using a depth gauge while simultaneously running our system in auto-capture mode. I built a small tool to ingest and compare the two data sets — though in hindsight, Excel would’ve been enough.
Back home, we ran a detailed analysis using Python, Pandas, Seaborn in Jupyter Notebooks. The results were clear: our sensors lacked the precision required for the task. We compiled our findings into a 20-page evaluation report highlighting exactly where and how the sensor data diverged from reality.
Ultimately, this led us to switch to a different sensor model — one with better precision, albeit a shorter range. Fortunately, since most bricks fell between 60 mm and 120 mm in height, the reduced range wasn’t a major limitation. It wasn’t a perfect solution, but it worked—and more importantly, it saved the project.
Expansion and Remote Control
After fixing the initial issues and replacing the sensors with suitable ones, the first systems started to work reliably. So reliable that the client requested additional systems for other production sites. These new locations were less accessible, making on-site troubleshooting impractical.
To support these installations, we implemented a remote access system. Each station automatically creates a reverse SSH tunnel to a central jump host upon startup. This approach allows us to connect to any deployed system through the host without requiring open inbound ports on the client’s network, as only outbound traffic is used. This infrastructure allows us to ship over-the-air updates, simplifies maintenance and enabled us to monitor all systems remotely.
Ongoing Improvements
Over the years, we refined both the hardware and software components of the system multiple times. The control unit was redesigned with new 3D models and custom PCBs. We replaced Arduino boards with direct ADC connections to the Raspberry Pi, reducing complexity and increasing reliability. As we gathered more feedback from operators, we identified areas for usability improvements.
One notable change was the removal of the numpad used to input the desired brick height. In practice, these keypads proved unreliable in the dusty environment and were often unintuitive. We replaced manual input with an automatic height detection system based on a lookup table of common values. After scanning two boards, the system can determine the current height with high confidence and adjust accordingly. This was a huge quality-of-life improvement for the operators.
In 2020, our good friend Levin Winckler joined us and took over electronics development. All current hardware designs are his work, and they've become far more robust and professional since.
Conclusion
Today, there are four systems actively running in production. The system achieves an accuracy of ±0.5 mm, scanning over 1000 boards per day and can operate at ambient temperatures up to 40 °C without active cooling. The project, which began in 2018, saw its last major development phase in 2023 and has remained stable and reliable since.
Throughout the course of this endeavor, we developed not only the main application but also numerous auxiliary tools for calibration, sensor speed testing, and system precision analysis. Each of these small utilities played a vital role in pushing the project toward completion.
This project taught us more than any university course could. It showed us how to tackle complex, open-ended problems, how to build things that actually work in the real world, and how important it is to test in the environments your systems are meant for.
And above all — it gave us the opportunity to develop something actually useful and appreciated by its users.
Lastly, here is a wireframe of one of the latest versions of the control unit, used as a t-shirt print for one of our hackathons.